


Office space for rent in Europe
There are 129,449 available office spaces in Europe right now. Companyspace.com collects office spaces from many different parts of the market, so that you as a company can more easily get an overview of available office spaces in Europe.
Companyspace.com today:
New today 2,877
Updated 24h 3,953
Notifications about new companyspaces1,241
Amsterdam +3
Berlin +3
Paris +5
Madrid +4
Dublin (county) +23
Warsaw +19
Greater London +12
Latest update 10 min ago
Active ads 368,919
129,449 office spaces found
Office space in Odense C, Odense
 More info
Office space in Odense C, Odense
Office space for rent in Odense C, Odense
Areal
Ca. 130 m2
Pris pr. md.
Ca. 16,000 DKK pr md
Område
Odense C, Odense
Type
Office space
Office space in Nørrebro, Copenhagen
 More info
Office space in Nørrebro, Copenhagen
Office space for rent in Nørrebro, Copenhagen
Areal
Ca. 345 m2
Pris pr. md.
Ca. 2,900 DKK pr md
Område
Nørrebro, Copenhagen
Type
Office space
Office space in Albertslund, Greater Copenhagen
More info
Office space in Albertslund, Greater Copenhagen
Office space for rent in Albertslund, Greater Copenhagen
Areal
Ca. 660 m2
Pris pr. md.
Ca. 38,550 DKK pr md
Område
Albertslund, Greater Copenhagen
Type
Office space
Office space in Slagelse, Region Zealand
More info
Office space in Slagelse, Region Zealand
Office space for rent in Slagelse, Region Zealand
Areal
Ca. 135 m2
Pris pr. md.
Ca. 10,500 DKK pr md
Område
Slagelse, Region Zealand
Type
Office space
Office space in Copenhagen K, Copenhagen
More info
Office space in Copenhagen K, Copenhagen
Office space for rent in Copenhagen K, Copenhagen
Areal
-
Pris pr. md.
Not stated
Område
Copenhagen K, Copenhagen
Type
Office space
Office space in Westland, South Holland
 More info
Office space in Westland, South Holland
Office space for rent in Westland, South Holland
Areal
Ca. 80 m2
Pris pr. md.
Ca. 1,550 EUR pr md
Område
Westland, South Holland
Type
Office space
Office space in Vallensbæk, Greater Copenhagen
More info
Office space in Vallensbæk, Greater Copenhagen
Office space for rent in Vallensbæk, Greater Copenhagen
Areal
Ca. 875 m2
Pris pr. md.
Ca. 65,400 DKK pr md
Område
Vallensbæk, Greater Copenhagen
Type
Office space
Office space in Albertslund, Greater Copenhagen
More info
Office space in Albertslund, Greater Copenhagen
Office space for rent in Albertslund, Greater Copenhagen
Areal
Ca. 3,260 m2
Pris pr. md.
Ca. 207,450 DKK pr md
Område
Albertslund, Greater Copenhagen
Type
Office space
Office space in Skanderborg, Central Jutland Region
More info
Office space in Skanderborg, Central Jutland Region
Office space for rent in Skanderborg, Central Jutland Region
Areal
Ca. 145 m2
Pris pr. md.
Ca. 7,800 DKK pr md
Område
Skanderborg, Central Jutland Region
Type
Office space
Office space in Albertslund, Greater Copenhagen
More info
Office space in Albertslund, Greater Copenhagen
Office space for rent in Albertslund, Greater Copenhagen
Areal
Ca. 765 m2
Pris pr. md.
Ca. 50,950 DKK pr md
Område
Albertslund, Greater Copenhagen
Type
Office space
Office space in Nørrebro, Copenhagen
More info
Office space in Nørrebro, Copenhagen
Office space for rent in Nørrebro, Copenhagen
Areal
Ca. 170 m2
Pris pr. md.
Ca. 1,250 DKK pr md
Område
Nørrebro, Copenhagen
Type
Office space
Office space in Alingsås, Västra Götaland County
 More info
Office space in Alingsås, Västra Götaland County
Office space for rent in Alingsås, Västra Götaland County
Areal
Ca. 95 m2
Pris pr. md.
Ca. 1,400 SEK pr md
Område
Alingsås, Västra Götaland County
Type
Office space
Office space in Svendborg, Funen
More info
Office space in Svendborg, Funen
Office space for rent in Svendborg, Funen
Areal
Ca. 625 m2
Pris pr. md.
Ca. 33,750 DKK pr md
Område
Svendborg, Funen
Type
Office space
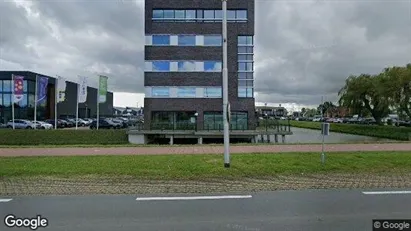
Office space in Woudenberg, Province of Utrecht
 More info
Office space in Woudenberg, Province of Utrecht
Office space for rent in Woudenberg, Province of Utrecht
Areal
-
Pris pr. md.
Ca. 850 EUR pr md
Område
Woudenberg, Province of Utrecht
Type
Office space
Office space in Barneveld, Gelderland
 More info
Office space in Barneveld, Gelderland
Office space for rent in Barneveld, Gelderland
Areal
-
Pris pr. md.
Not stated
Område
Barneveld, Gelderland
Type
Office space
Office space in Odense C, Odense
 More info
Office space in Odense C, Odense
Office space for rent in Odense C, Odense
Areal
Ca. 110 m2
Pris pr. md.
Ca. 7,350 DKK pr md
Område
Odense C, Odense
Type
Office space
Office space in Mikkeli, Etelä-Savo
 More info
Office space in Mikkeli, Etelä-Savo
Office space for rent in Mikkeli, Etelä-Savo
Areal
-
Pris pr. md.
Not stated
Område
Mikkeli, Etelä-Savo
Type
Office space
Office space in Greve, Greater Copenhagen
 More info
Office space in Greve, Greater Copenhagen
Office space for rent in Greve, Greater Copenhagen
Areal
Ca. 400 m2
Pris pr. md.
Ca. 46,450 DKK pr md
Område
Greve, Greater Copenhagen
Type
Office space
Selected customers
30,000 customers use Companyspace.com
30,000 customers
285,000 companies in our database
2,400 rentals annually
Companyspace.com is used by thousands of landlords, property companies, commercial real estate agents, investors and business centres seeking greater visibility, more enquiries and lower vacancy rates.


