Commercial property for rent in Province of Utrecht
-
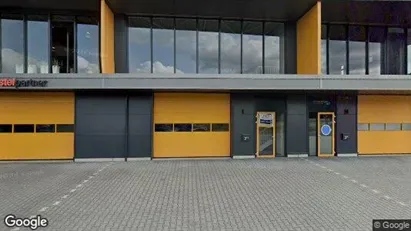
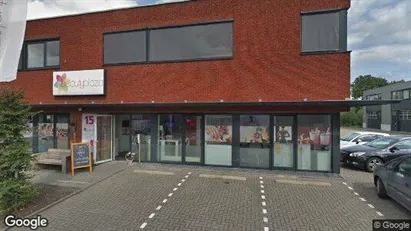
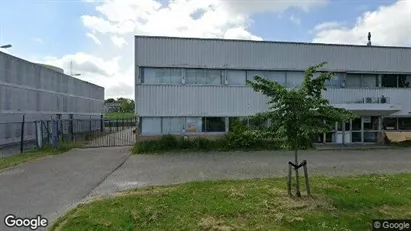
1071 m2 commercial space for rent in Amersfoort, Province of Utrecht
- 5,500 EUR per month
- 61.62 EUR /m2/year
-
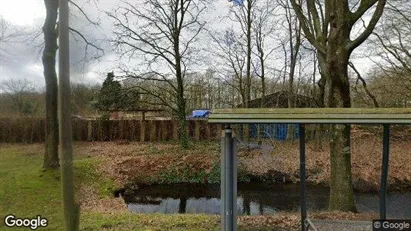
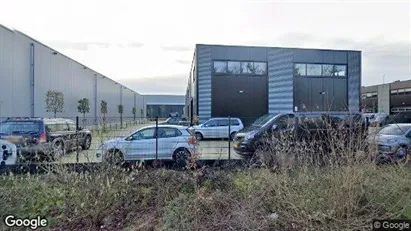
212 m2 commercial space for rent in Woudenberg, Province of Utrecht
- 1,550 EUR per month
- 87.74 EUR /m2/year
-
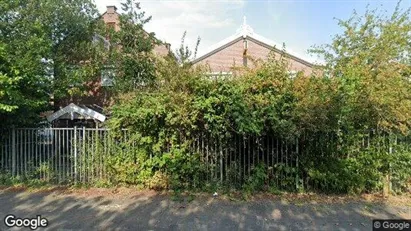
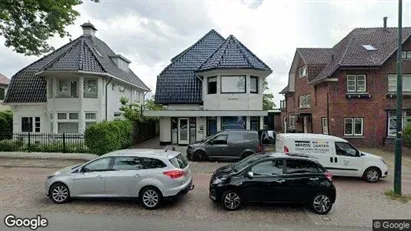
1257 m2 commercial space for rent in Utrecht West, Utrecht
- 6,250 EUR per month
- 59.67 EUR /m2/year
-
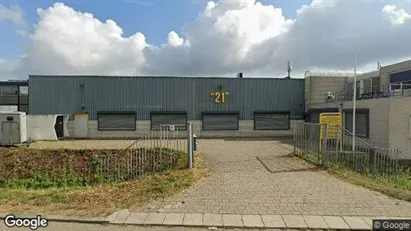
244 m2 commercial space for rent in Eemnes, Province of Utrecht
- 1,950 EUR per month
- 95.90 EUR /m2/year
-
255 m2 commercial space for rent in Utrecht Overvecht, Utrecht
- 2,950 EUR per month
- 138.82 EUR /m2/year
-
82 m2 commercial space for rent in Utrecht West, Utrecht
- 1,900 EUR per month
- 278.05 EUR /m2/year
-
113 m2 commercial space for rent in Montfoort, Province of Utrecht
- 2,500 EUR per month
- 265.49 EUR /m2/year
-
408 m2 commercial space for rent in Woerden, Province of Utrecht
- 1,795 EUR per month
- 52.79 EUR /m2/year
-
100 m2 commercial space for rent in Amersfoort, Province of Utrecht
- 1,475 EUR per month
- 177 EUR /m2/year
-
165 m2 commercial space for rent in Amersfoort, Province of Utrecht
- 1,650 EUR per month
- 120 EUR /m2/year
-
179 m2 commercial space for rent in Soest, Province of Utrecht
- 1,250 EUR per month
- 83.80 EUR /m2/year
-
64 m2 commercial space for rent in Soest, Province of Utrecht
- 1,385 EUR per month
- 259.69 EUR /m2/year
Frequently asked questions
Statistics on the development of available commercial properties for rent in Province of Utrecht over the past month
Below you can see the development of available commercial properties for rent in Province of Utrecht over the past month. In the first column you see the date. In the second column you see the total amount of commercial properties for rent in Province of Utrecht on the date. In the third column you see the amount of new commercial properties in Province of Utrecht that was available for rent on the date. In the fourth column you see the amount of commercial properties in Province of Utrecht that was rented on the date. Also see aggregate statistics on all available commercial properties in Province of Utrecht over time, aggregate statistics on new commercial properties in Province of Utrecht over time, aggregate statistics on rented commercial properties in Province of Utrecht over time
| Date | All commercial properties for rent | New commercial properties for rent | Rented out commercial properties |
|---|---|---|---|
| 21. October 2025 | 538 | 22 | 28 |
| 20. October 2025 | 544 | 20 | 23 |
| 19. October 2025 | 547 | 3 | 0 |
| 18. October 2025 | 544 | 2 | 2 |
| 17. October 2025 | 544 | 100 | 88 |
| 16. October 2025 | 532 | 89 | 0 |
| 15. October 2025 | 443 | 8 | 92 |
| 14. October 2025 | 527 | 1 | 11 |
| 13. October 2025 | 537 | 21 | 14 |
| 12. October 2025 | 530 | 6 | 12 |
| 11. October 2025 | 536 | 7 | 14 |
| 10. October 2025 | 543 | 10 | 2 |
| 9. October 2025 | 535 | 1 | 5 |
| 8. October 2025 | 539 | 22 | 23 |
| 7. October 2025 | 540 | 2 | 1 |
| 6. October 2025 | 539 | 0 | 1 |
| 5. October 2025 | 540 | 19 | 21 |
| 4. October 2025 | 542 | 7 | 15 |
| 3. October 2025 | 550 | 6 | 0 |
| 2. October 2025 | 544 | 7 | 9 |
| 1. October 2025 | 546 | 26 | 27 |
| 30. September 2025 | 547 | 2 | 7 |
| 29. September 2025 | 552 | 4 | 4 |
| 28. September 2025 | 552 | 4 | 2 |
| 27. September 2025 | 550 | 26 | 24 |
| 26. September 2025 | 548 | 24 | 16 |
| 25. September 2025 | 540 | 0 | 3 |
| 24. September 2025 | 543 | 0 | 1 |
| 23. September 2025 | 544 | 2 | 2 |
| 22. September 2025 | 544 | 2 | 5 |
| 21. September 2025 | 547 | 6 | 0 |
Statistics on currently available commercial properties for rent in Province of Utrecht in The Netherlands
In the table below, you see a series of data about available commercial properties to rent in Province of Utrecht.Also see gathered statistics of all available commercial properties in Province of Utrecht over time, the gathered statistics of new commercial properties in Province of Utrecht over time, the gathered statistics of rented commercial properties in Province of Utrecht over time
| Commercial properties | |
|---|---|
| Available premises | 540 |
| New premises since yesterday | 22 |
| Rented out premises since yesterday | 28 |
| Total available m2 | 342,809 |
| Average price per m2 per year without expenses | 273 |
| Highest price per m2 per year | 23,181.82 |
| Lowest price per m2 per year | 1.8 |


