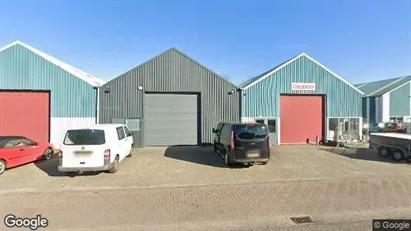
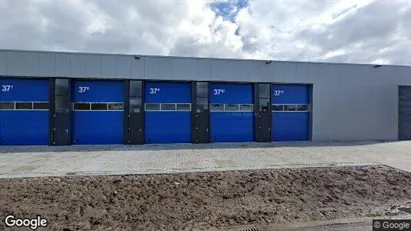
Commercial space in The Netherlands
See all available business premises, commercial properties and commercial spaces in The Netherlands below. If you are looking for commercial real estate, business space, a business premise or commercial space in The Netherlands, you have come to the right place. We have most available commercial spaces in The Netherlands in our database. Find your business premise in The Netherlands here. Enjoy.
20,537 company spaces found
-
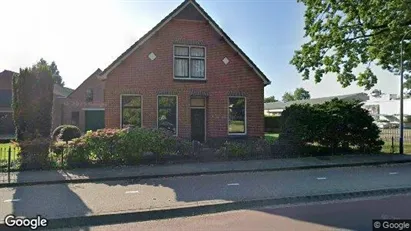
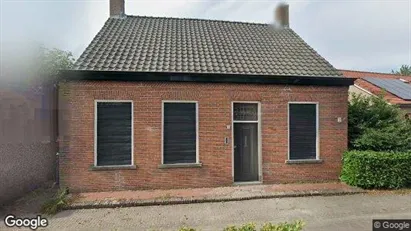
144 m2 commercial space for rent in Oosterhout, North Brabant
- 1,195 EUR per month
- 99.58 EUR /m2/year
-
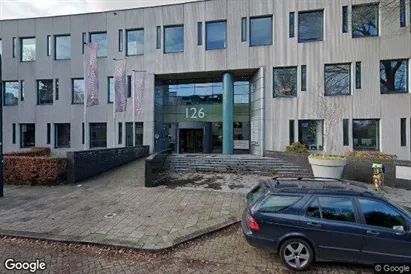
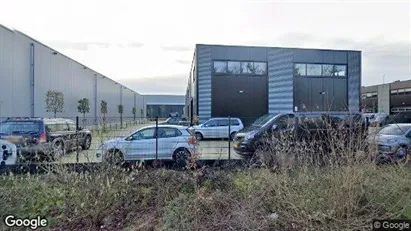
136 m2 commercial space for rent in Amstelveen, North Holland
- 1,700 EUR per month
- 150 EUR /m2/year
-
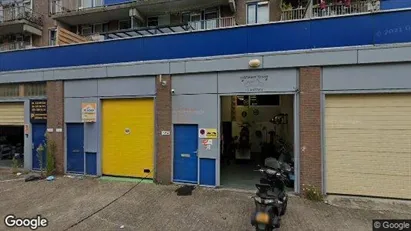
306 m2 commercial space for rent in Marum, Groningen (region)
- 900 EUR per month
- 35.29 EUR /m2/year
-
210 m2 office space for rent in Terneuzen, Zeeland
- 875 EUR per month
- 50 EUR /m2/year
-
100 m2 office space for rent in Baarn, Province of Utrecht
- 1,335 EUR per month
- 160.20 EUR /m2/year
-
77 m2 commercial space for rent in Lelystad, Flevoland
- 850 EUR per month
- 132.47 EUR /m2/year
-
135 m2 commercial space for rent in The Hague Centrum, The Hague
- 2,250 EUR per month
- 200 EUR /m2/year
-
110 m2 commercial space for rent in Veenendaal, Province of Utrecht
- 1,750 EUR per month
- 190.91 EUR /m2/year
-
45 m2 commercial space for rent in Drimmelen, North Brabant
- 450 EUR per month
- 120 EUR /m2/year
-
179 m2 commercial space for rent in Soest, Province of Utrecht
- 1,250 EUR per month
- 83.80 EUR /m2/year
-
83 m2 office space for rent in Berg en Dal, Gelderland
- 1,050 EUR per month
- 151.81 EUR /m2/year
-
171 m2 commercial space for rent in Schagen, North Holland
- 1,500 EUR per month
- 105.26 EUR /m2/year
-
45 m2 commercial space for rent in Enschede, Overijssel
- 575 EUR per month
- 153.33 EUR /m2/year
Frequently asked questions
Statistics on the development of available commercial real estate for rent in The Netherlands over the past month
Also see aggregate statistics on all available commercial rentals in The Netherlands over time, aggregate statistics on new commercial rentals in The Netherlands over time, aggregate statistics on rented commercial real estate in The Netherlands over time
| Date | |||
|---|---|---|---|
| 17. October 2025 | 16623 | 1226 | 382 |
| 16. October 2025 | 15779 | 501 | 62 |
| 15. October 2025 | 15340 | 390 | 761 |
| 14. October 2025 | 15711 | 37 | 1058 |
| 13. October 2025 | 16732 | 460 | 282 |
| 12. October 2025 | 16554 | 524 | 523 |
| 11. October 2025 | 16553 | 159 | 156 |
| 10. October 2025 | 16550 | 459 | 635 |
| 9. October 2025 | 16726 | 150 | 39 |
| 8. October 2025 | 16615 | 404 | 440 |
| 7. October 2025 | 16651 | 273 | 290 |
| 6. October 2025 | 16668 | 129 | 70 |
| 5. October 2025 | 16609 | 199 | 322 |
| 4. October 2025 | 16732 | 294 | 380 |
| 3. October 2025 | 16818 | 244 | 194 |
| 2. October 2025 | 16768 | 214 | 246 |
| 1. October 2025 | 16800 | 267 | 164 |
| 30. September 2025 | 16697 | 203 | 304 |
| 29. September 2025 | 16798 | 184 | 176 |
| 28. September 2025 | 16790 | 331 | 214 |
| 27. September 2025 | 16673 | 480 | 209 |
| 26. September 2025 | 16402 | 332 | 277 |
| 25. September 2025 | 16347 | 40 | 336 |
| 24. September 2025 | 16643 | 338 | 13 |
| 23. September 2025 | 16318 | 168 | 438 |
| 22. September 2025 | 16588 | 152 | 289 |
| 21. September 2025 | 16725 | 274 | 108 |
| 20. September 2025 | 16559 | 361 | 473 |
| 19. September 2025 | 16671 | 282 | 153 |
| 18. September 2025 | 16542 | 204 | 330 |
| 17. September 2025 | 16668 | 351 | 0 |
Statistics on currently available commercial spaces in The Netherlands
Also see gathered statistics of all available commercial space over time, the gathered statistics of new commercial space over time, the gathered statistics of rented commercial space over time
| Total | |
|---|---|
| Available premises | 16,393 |
| New premises since yesterday | 1,226 |
| Rented out premises since yesterday | 382 |
| Total available m2 | 68,435,425 |
| Average price per m2 per year without expenses | 856 |
| Highest price per m2 per year | 1,900,000 |
| Lowest price per m2 per year | 1 |


