


Commercial premises for rent in Tilburg
There are 165 available commercial properties in Tilburg right now. Companyspace.com collects commercial properties from many different parts of the market, so that you as a company can more easily get an overview of available commercial properties in Tilburg.
Companyspace.com today:
New today 1,124
Updated 24h 1,128
Notifications about new companyspaces1,932
Copenhagen +4
Stockholm +3
Berlin +19
Oslo +1
Brussels +5
Warsaw +13
Latest update 1 h ago
Active ads 318,886
165 company spaces found
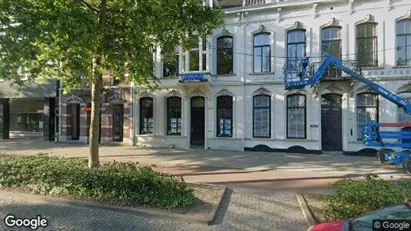
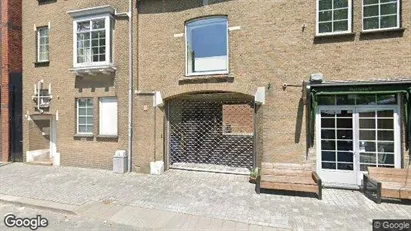
Office space in Tilburg, North Brabant
 More info
Office space in Tilburg, North Brabant
Office space for rent in Tilburg, North Brabant
Areal
Ca. 35 m2
Pris pr. md.
Ca. 1,100 EUR pr md
Område
Tilburg, North Brabant
Type
Office space
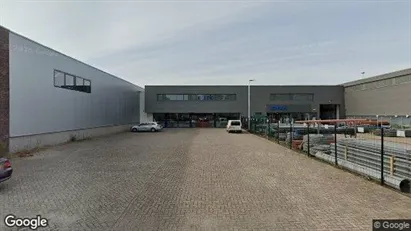
Industrial property in Tilburg, North Brabant
 More info
Industrial property in Tilburg, North Brabant
Industrial property for rent in Tilburg, North Brabant
Areal
Ca. 1,335 m2
Pris pr. md.
Ca. 8,750 EUR pr md
Område
Tilburg, North Brabant
Type
Industrial property
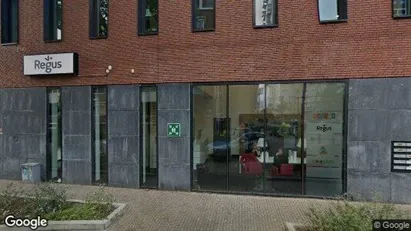
Office space in Tilburg, North Brabant
 More info
Office space in Tilburg, North Brabant
Office space for rent in Tilburg, North Brabant
Areal
Ca. 550 m2
Pris pr. md.
Ca. 4,350 EUR pr md
Område
Tilburg, North Brabant
Type
Office space
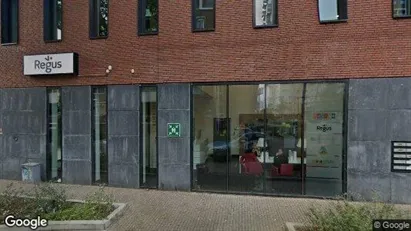
Office space in Tilburg, North Brabant
 More info
Office space in Tilburg, North Brabant
Office space for rent in Tilburg, North Brabant
Areal
Ca. 35 m2
Pris pr. md.
Ca. 1,200 EUR pr md
Område
Tilburg, North Brabant
Type
Office space
Office space in Tilburg, North Brabant
 More info
Office space in Tilburg, North Brabant
Office space for rent in Tilburg, North Brabant
Areal
Ca. 300 m2
Pris pr. md.
Ca. 2,450 EUR pr md
Område
Tilburg, North Brabant
Type
Office space
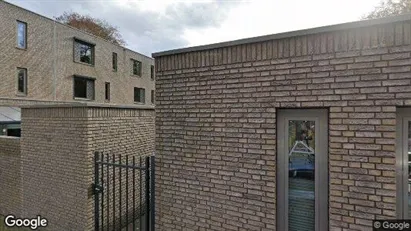
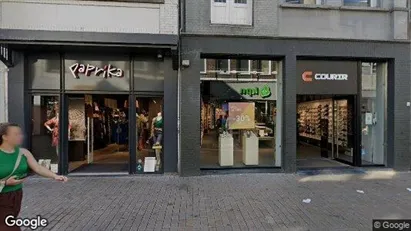
Commercial space in Tilburg, North Brabant
 More info
Commercial space in Tilburg, North Brabant
Commercial space for rent in Tilburg, North Brabant
Areal
Ca. 165 m2
Pris pr. md.
Ca. 1,200 EUR pr md
Område
Tilburg, North Brabant
Type
Commercial property
Office space in Tilburg, North Brabant
 More info
Office space in Tilburg, North Brabant
Office space for rent in Tilburg, North Brabant
Areal
Ca. 235 m2
Pris pr. md.
Ca. 2,200 EUR pr md
Område
Tilburg, North Brabant
Type
Office space
Commercial space in Tilburg, North Brabant
 More info
Commercial space in Tilburg, North Brabant
Commercial space for rent in Tilburg, North Brabant
Areal
-
Pris pr. md.
Ca. 18,600 EUR pr md
Område
Tilburg, North Brabant
Type
Commercial property
Commercial space in Tilburg, North Brabant
 More info
Commercial space in Tilburg, North Brabant
Commercial space for rent in Tilburg, North Brabant
Areal
-
Pris pr. md.
Ca. 1,995,000 EUR pr md
Område
Tilburg, North Brabant
Type
Commercial property
Commercial space in Tilburg, North Brabant
 More info
Commercial space in Tilburg, North Brabant
Commercial space for rent in Tilburg, North Brabant
Areal
Ca. 145 m2
Pris pr. md.
Ca. 7,500 EUR pr md
Område
Tilburg, North Brabant
Type
Commercial property
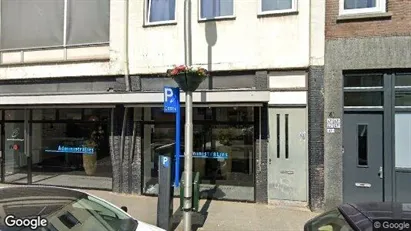
Office space in Tilburg, North Brabant
 More info
Office space in Tilburg, North Brabant
Office space for rent in Tilburg, North Brabant
Areal
Ca. 10 m2
Pris pr. md.
Ca. 100 EUR pr md
Område
Tilburg, North Brabant
Type
Office space
Office space in Tilburg, North Brabant
 More info
Office space in Tilburg, North Brabant
Office space for rent in Tilburg, North Brabant
Areal
Ca. 120 m2
Pris pr. md.
Ca. 4,350 EUR pr md
Område
Tilburg, North Brabant
Type
Office space
Office space in Tilburg, North Brabant
 More info
Office space in Tilburg, North Brabant
Office space for rent in Tilburg, North Brabant
Areal
Ca. 75 m2
Pris pr. md.
Ca. 1,400 EUR pr md
Område
Tilburg, North Brabant
Type
Office space
Office space in Tilburg, North Brabant
 More info
Office space in Tilburg, North Brabant
Office space for rent in Tilburg, North Brabant
Areal
Ca. 10 m2
Pris pr. md.
Ca. 450 EUR pr md
Område
Tilburg, North Brabant
Type
Office space
Office space in Tilburg, North Brabant
 More info
Office space in Tilburg, North Brabant
Office space for rent in Tilburg, North Brabant
Areal
Ca. 30 m2
Pris pr. md.
Ca. 750 EUR pr md
Område
Tilburg, North Brabant
Type
Office space
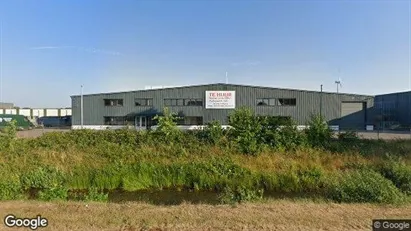
Industrial property in Tilburg, North Brabant
 More info
Industrial property in Tilburg, North Brabant
Industrial property for rent in Tilburg, North Brabant
Areal
Ca. 2,050 m2
Pris pr. md.
Ca. 13,000 EUR pr md
Område
Tilburg, North Brabant
Type
Industrial property
Commercial space in Tilburg, North Brabant
 More info
Commercial space in Tilburg, North Brabant
Commercial space for rent in Tilburg, North Brabant
Areal
Ca. 100 m2
Pris pr. md.
Ca. 350 EUR pr md
Område
Tilburg, North Brabant
Type
Commercial property
Commercial space in Tilburg, North Brabant
 More info
Commercial space in Tilburg, North Brabant
Commercial space for rent in Tilburg, North Brabant
Areal
Ca. 900 m2
Pris pr. md.
Ca. 8,500 EUR pr md
Område
Tilburg, North Brabant
Type
Commercial property
Selected customers
30,000 customers use Companyspace.com
30,000 customers
285,000 companies in our database
2,400 rentals annually
Companyspace.com is used by thousands of landlords, property companies, commercial real estate agents, investors and business centres seeking greater visibility, more enquiries and lower vacancy rates.


