


Commercial premises for rentin North Brabant
There are 2,456 available commercial properties in North Brabant right now. Companyspace.com collects commercial properties from many different parts of the market, so that you as a company can more easily get an overview of available commercial properties in North Brabant.
Companyspace.com today:
New today 1,071
Updated 24h 1,334
Notifications about new companyspaces1,623
Copenhagen +2
Stockholm +4
Amsterdam +1
Berlin +7
Oslo +2
Brussels +13
Vienna +31
Paris +5
Dublin (county) +36
Warsaw +36
Latest update 1 h ago
Active ads 360,580
2,456 company spaces found
Shop in Deurne, North Brabant
More info
We monitor the market!
Shop in Deurne, North Brabant
Winkelruimte te huur, ook geschikt als kantoorruimte of werkplaats, 200 M2, voldoende gratis parkeerplekken naast het pand, gelegenheid voor laden en lossen ...
Areal
Ca. 200 m2
Pris pr. md.
Not stated
Område
Deurne, North Brabant
Type
Shop
Clinic in Eindhoven, North Brabant
More info
We monitor the market!
Clinic in Eindhoven, North Brabant
2 kamers met wachtkamer, wc en keuken
Areal
Ca. 100 m2
Pris pr. md.
Not stated
Område
Eindhoven, North Brabant
Type
Clinic
Commercial space in Breda, North Brabant
 More info
Commercial space in Breda, North Brabant
Commercial space for rent in Breda, North Brabant
Areal
Ca. 235 m2
Pris pr. md.
Ca. 1,950 EUR pr md
Område
Breda, North Brabant
Type
Commercial property
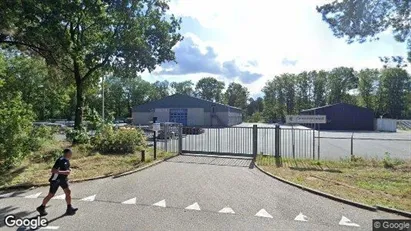
Commercial space in Moerdijk, North Brabant
 More info
Commercial space in Moerdijk, North Brabant
Commercial space for rent in Moerdijk, North Brabant
Areal
Ca. 3,335 m2
Pris pr. md.
Not stated
Område
Moerdijk, North Brabant
Type
Commercial property
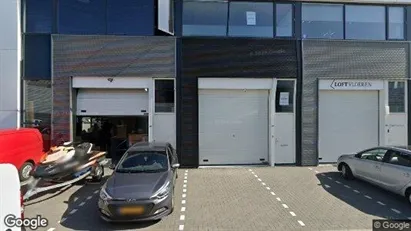
Commercial space in Moerdijk, North Brabant
 More info
Commercial space in Moerdijk, North Brabant
Commercial space for rent in Moerdijk, North Brabant
Areal
Ca. 3,175 m2
Pris pr. md.
Not stated
Område
Moerdijk, North Brabant
Type
Commercial property
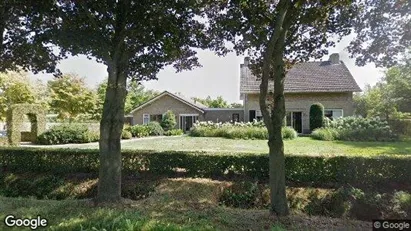
Commercial space in Breda, North Brabant
 More info
Commercial space in Breda, North Brabant
Commercial space for rent in Breda, North Brabant
Areal
Ca. 100 m2
Pris pr. md.
Ca. 1,950 EUR pr md
Område
Breda, North Brabant
Type
Commercial property
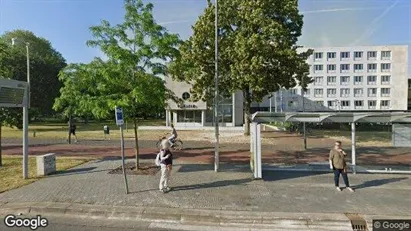
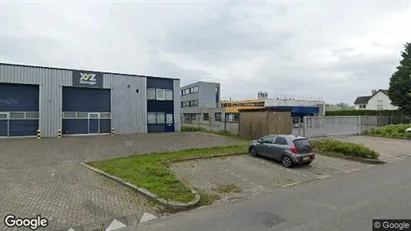
Office space in Den Bosch, North Brabant
 More info
Office space in Den Bosch, North Brabant
Office space for rent in Den Bosch, North Brabant
Areal
Ca. 80 m2
Pris pr. md.
Ca. 700 EUR pr md
Område
Den Bosch, North Brabant
Type
Office space
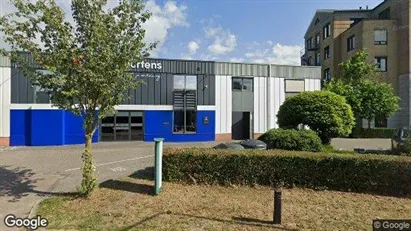
Office space in Breda, North Brabant
 More info
Office space in Breda, North Brabant
Office space for rent in Breda, North Brabant
Areal
Ca. 25 m2
Pris pr. md.
Ca. 650 EUR pr md
Område
Breda, North Brabant
Type
Office space
Commercial space in Tilburg, North Brabant
 More info
Commercial space in Tilburg, North Brabant
Commercial space for rent in Tilburg, North Brabant
Areal
Ca. 165 m2
Pris pr. md.
Ca. 1,200 EUR pr md
Område
Tilburg, North Brabant
Type
Commercial property
Commercial space in Halderberge, North Brabant
 More info
Commercial space in Halderberge, North Brabant
Commercial space for rent in Halderberge, North Brabant
Areal
Ca. 165 m2
Pris pr. md.
Ca. 1,450 EUR pr md
Område
Halderberge, North Brabant
Type
Commercial property
Office space in Eindhoven, North Brabant
 More info
Office space in Eindhoven, North Brabant
Kantoor te huur in Eindhoven, Noord-Brabant
Areal
-
Pris pr. md.
Ca. 1,400 EUR pr md
Område
Eindhoven, North Brabant
Type
Office space
Commercial space in Gemert-Bakel, North Brabant
 More info
Commercial space in Gemert-Bakel, North Brabant
Commercial space for rent in Gemert-Bakel, North Brabant
Areal
Ca. 75 m2
Pris pr. md.
Ca. 1,050 EUR pr md
Område
Gemert-Bakel, North Brabant
Type
Commercial property
Office space in Eindhoven, North Brabant
 More info
Office space in Eindhoven, North Brabant
Office space for rent in Eindhoven, North Brabant
Areal
Ca. 75 m2
Pris pr. md.
Ca. 1,550 EUR pr md
Område
Eindhoven, North Brabant
Type
Office space
Commercial space in Nuenen, Gerwen en Nederwetten, North Brabant
 More info
Commercial space in Nuenen, Gerwen en Nederwetten, North Brabant
Commercial space for rent in Nuenen, Gerwen en Nederwetten, North Brabant
Areal
-
Pris pr. md.
Ca. 400 EUR pr md
Område
Nuenen, Gerwen en Nederwetten, North Brabant
Type
Commercial property
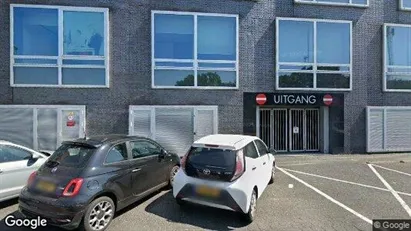
Office space in Breda, North Brabant
 More info
Office space in Breda, North Brabant
Bedrijfsunit/kantoorruimte van c.a. 69 m2 (gelegen op de eerste verdieping die via een trap te bereiken is)+een kleine Pantry en Toilet gelegen op de begane ...
Areal
Ca. 70 m2
Pris pr. md.
Ca. 8,350 EUR pr md
Område
Breda, North Brabant
Type
Office space
Shop in Oss, North Brabant
More info
We monitor the market!
Shop in Oss, North Brabant
Shop for rent in Oss, North Brabant
Areal
Ca. 50 m2
Pris pr. md.
Ca. 200 EUR pr md
Område
Oss, North Brabant
Type
Shop
Commercial space in Meierijstad, North Brabant
 More info
Commercial space in Meierijstad, North Brabant
Commercial space for rent in Meierijstad, North Brabant
Areal
Ca. 2,100 m2
Pris pr. md.
Not stated
Område
Meierijstad, North Brabant
Type
Commercial property
Office space in Roosendaal, North Brabant
 More info
Office space in Roosendaal, North Brabant
Office space for rent in Roosendaal, North Brabant
Areal
Ca. 120 m2
Pris pr. md.
Ca. 200 EUR pr md
Område
Roosendaal, North Brabant
Type
Office space
Selected customers
30,000 customers use Companyspace.com
30,000 customers
285,000 companies in our database
2,400 rentals annually
Companyspace.com is used by thousands of landlords, property companies, commercial real estate agents, investors and business centres seeking greater visibility, more enquiries and lower vacancy rates.


