


Commercial premises for rentin Limburg
There are 859 available commercial properties in Limburg right now. Companyspace.com collects commercial properties from many different parts of the market, so that you as a company can more easily get an overview of available commercial properties in Limburg.
Companyspace.com today:
New today 613
Updated 24h 642
Notifications about new companyspaces2,198
Copenhagen +3
Stockholm +4
Amsterdam +12
Berlin +1
Zürich +2
Vienna +15
Paris +5
Madrid +1
Dublin (county) +48
Warsaw +12
Greater London +6
Latest update 48 min ago
Active ads 369,552
859 company spaces found
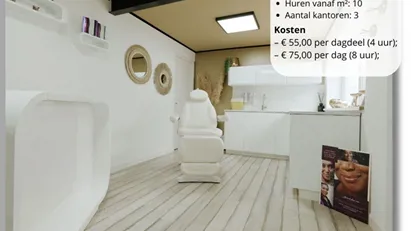
Clinic in Venlo, Limburg
 More info
Clinic in Venlo, Limburg
Salon ruimte te huur in Venlo.
Deze moderne en volledig ingerichte salon ruimte te huur ligt dichtbij de snelweg gelegen aan een rustige straat met gratis...
Areal
Ca. 220 m2
Pris pr. md.
Ca. 50 EUR/mo
Område
Venlo, Limburg
Type
Clinic
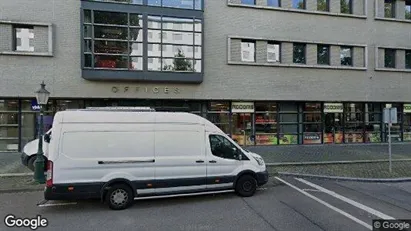
Office space in Maastricht, Limburg
 More info
Office space in Maastricht, Limburg
Kantoorruimte 18 m2: te huur per 1 Juli tot en met 31 Oktober, met mogelijkheid om contract onbeperkt te verlengen.
Huurprijs ca. 585 ex BTW, All inclusief...
Areal
Ca. 20 m2
Pris pr. md.
Ca. 500 EUR pr md
Område
Maastricht, Limburg
Type
Office space
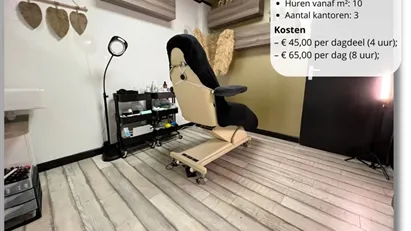
Clinic in Venlo, Limburg
 More info
Clinic in Venlo, Limburg
Salon ruimte te huur in Venlo
Salon ruimte te huur in Venlo.
Deze moderne en volledig ingerichte salon ruimte te huur ligt dichtbij de snelweg gelegen aa...
Areal
10 - 219 m2
Pris pr. md.
Not stated
Område
Venlo, Limburg
Type
Clinic
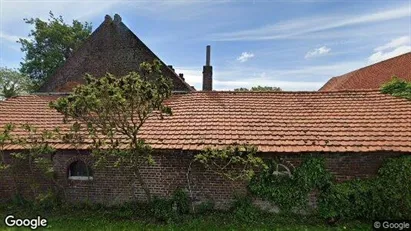
Clinic in Leudal, Limburg
 More info
Clinic in Leudal, Limburg
Prachtige yurt te huur voor zingevende en coachende activiteiten. Omringd door natuur.
Areal
Ca. 35 m2
Pris pr. md.
Not stated
Område
Leudal, Limburg
Type
Clinic
Restaurant in Venray, Limburg
More info
We monitor the market!
Restaurant in Venray, Limburg
ERA Studio’s: the perfect location for your party or event.
Are you looking for a unique, atmospheric location for your company or staff party, anniversary...
Areal
Ca. 220 m2
Pris pr. md.
Not stated
Område
Venray, Limburg
Type
Restaurant
Shop in Maastricht, Limburg
More info
We monitor the market!
Shop in Maastricht, Limburg
Shop for rent in Maastricht, Limburg
Areal
Ca. 50 m2
Pris pr. md.
Not stated
Område
Maastricht, Limburg
Type
Shop
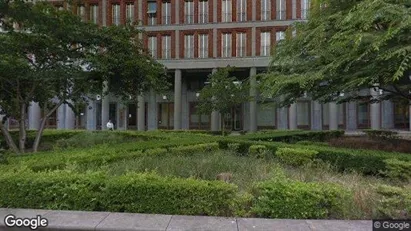
Office space in Maastricht, Limburg
 More info
Office space in Maastricht, Limburg
Office space for rent in Maastricht, Limburg
Areal
Ca. 100 m2
Pris pr. md.
Ca. 2,650 EUR pr md
Område
Maastricht, Limburg
Type
Office space
Office space in Sittard-Geleen, Limburg
 More info
Office space in Sittard-Geleen, Limburg
Office space for rent in Sittard-Geleen, Limburg
Areal
Ca. 135 m2
Pris pr. md.
Not stated
Område
Sittard-Geleen, Limburg
Type
Office space
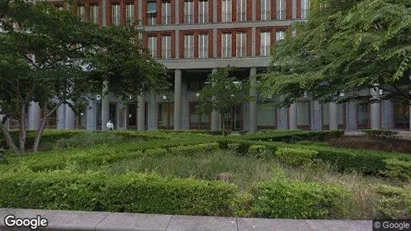
Office space in Maastricht, Limburg
 More info
Office space in Maastricht, Limburg
Office space for rent in Maastricht, Limburg
Areal
Ca. 25 m2
Pris pr. md.
Ca. 500 EUR pr md
Område
Maastricht, Limburg
Type
Office space
Office space in Maastricht, Limburg
 More info
Office space in Maastricht, Limburg
Office space for rent in Maastricht, Limburg
Areal
Ca. 10 m2
Pris pr. md.
Ca. 100 EUR pr md
Område
Maastricht, Limburg
Type
Office space
Office space in Maastricht, Limburg
 More info
Office space in Maastricht, Limburg
Office space for rent in Maastricht, Limburg
Areal
Ca. 110 m2
Pris pr. md.
Ca. 3,300 EUR pr md
Område
Maastricht, Limburg
Type
Office space
Office space in Maastricht, Limburg
 More info
Office space in Maastricht, Limburg
Office space for rent in Maastricht, Limburg
Areal
Ca. 75 m2
Pris pr. md.
Ca. 800 EUR pr md
Område
Maastricht, Limburg
Type
Office space
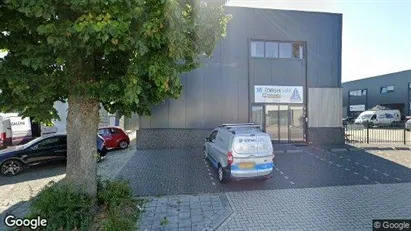
Commercial space in Sittard-Geleen, Limburg
 More info
Commercial space in Sittard-Geleen, Limburg
Commercial space for rent in Sittard-Geleen, Limburg
Areal
Ca. 180 m2
Pris pr. md.
Ca. 1,300 EUR pr md
Område
Sittard-Geleen, Limburg
Type
Commercial property
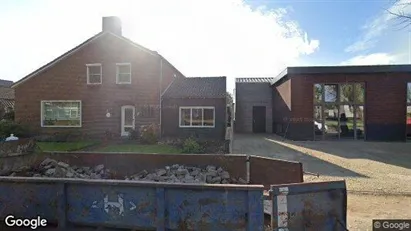
Commercial space in Weert, Limburg
 More info
Commercial space in Weert, Limburg
Commercial space for rent in Weert, Limburg
Areal
Ca. 300 m2
Pris pr. md.
Ca. 2,100 EUR pr md
Område
Weert, Limburg
Type
Commercial property
Office space in Maastricht, Limburg
 More info
Office space in Maastricht, Limburg
Office space for rent in Maastricht, Limburg
Areal
Ca. 110 m2
Pris pr. md.
Ca. 2,750 EUR pr md
Område
Maastricht, Limburg
Type
Office space
Commercial space in Echt-Susteren, Limburg
 More info
Commercial space in Echt-Susteren, Limburg
Commercial space for rent in Echt-Susteren, Limburg
Areal
Ca. 250 m2
Pris pr. md.
Ca. 1,500 EUR pr md
Område
Echt-Susteren, Limburg
Type
Commercial property
Office space in Gennep, Limburg
 More info
Office space in Gennep, Limburg
Office space for rent in Gennep, Limburg
Areal
Ca. 335 m2
Pris pr. md.
Ca. 2,150 EUR pr md
Område
Gennep, Limburg
Type
Office space
Office space in Maastricht, Limburg
 More info
Office space in Maastricht, Limburg
Office space for rent in Maastricht, Limburg
Areal
Ca. 285 m2
Pris pr. md.
Ca. 3,050 EUR pr md
Område
Maastricht, Limburg
Type
Office space
Selected customers
30,000 customers use Companyspace.com
30,000 customers
285,000 companies in our database
2,400 rentals annually
Companyspace.com is used by thousands of landlords, property companies, commercial real estate agents, investors and business centres seeking greater visibility, more enquiries and lower vacancy rates.


