


Commercial premises for rent in Gennep
There are 20 available commercial properties in Gennep right now. Companyspace.com collects commercial properties from many different parts of the market, so that you as a company can more easily get an overview of available commercial properties in Gennep.
Companyspace.com today:
New today 141
Updated 24h 629
Notifications about new companyspaces20
Copenhagen +1
Stockholm +1
Dublin (county) +1
Warsaw +3
Latest update 1 h ago
Active ads 364,351
20 company spaces found
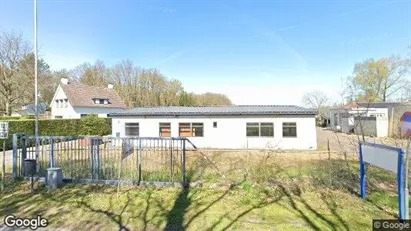
Office space in Gennep, Limburg
 More info
Office space in Gennep, Limburg
Office space for rent in Gennep, Limburg
Areal
Ca. 220 m2
Pris pr. md.
Ca. 1,500 EUR per month
Område
Gennep, Limburg
Type
Office space
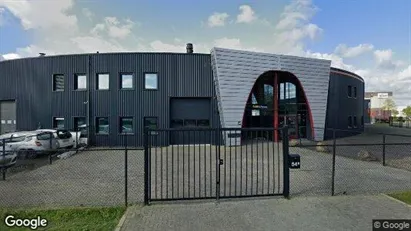
Commercial space in Gennep, Limburg
 More info
Commercial space in Gennep, Limburg
Commercial space for rent in Gennep, Limburg
Areal
Ca. 50 m2
Pris pr. md.
Ca. 1,000 EUR per month
Område
Gennep, Limburg
Type
Commercial property
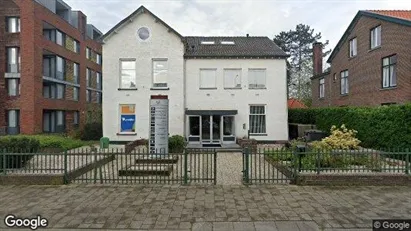
Commercial space in Gennep, Limburg
 More info
Commercial space in Gennep, Limburg
Commercial space for rent in Gennep, Limburg
Areal
Ca. 570 m2
Pris pr. md.
Ca. 2,950 EUR per month
Område
Gennep, Limburg
Type
Commercial property
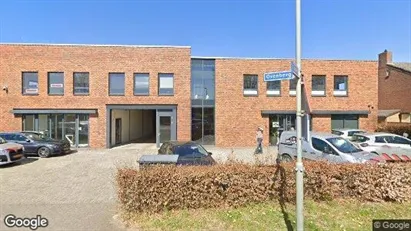
Office space in Gennep, Limburg
 More info
Office space in Gennep, Limburg
Office space for rent in Gennep, Limburg
Areal
Ca. 335 m2
Pris pr. md.
Ca. 2,500 EUR per month
Område
Gennep, Limburg
Type
Office space
Office space in Gennep, Limburg
 More info
Office space in Gennep, Limburg
Office space for rent in Gennep, Limburg
Areal
Ca. 70 m2
Pris pr. md.
Ca. 950 EUR per month
Område
Gennep, Limburg
Type
Office space
Commercial space in Gennep, Limburg
 More info
Commercial space in Gennep, Limburg
Commercial space for rent in Gennep, Limburg
Areal
Ca. 1,360 m2
Pris pr. md.
Ca. 6,250 EUR per month
Område
Gennep, Limburg
Type
Commercial property
Commercial space in Gennep, Limburg
 More info
Commercial space in Gennep, Limburg
Commercial space for rent in Gennep, Limburg
Areal
Ca. 2,955 m2
Pris pr. md.
Ca. 16,500 EUR per month
Område
Gennep, Limburg
Type
Commercial property
Office space in Gennep, Limburg
 More info
Office space in Gennep, Limburg
Office space for rent in Gennep, Limburg
Areal
Ca. 65 m2
Pris pr. md.
Ca. 450 EUR per month
Område
Gennep, Limburg
Type
Office space
Office space in Gennep, Limburg
 More info
Office space in Gennep, Limburg
Office space for rent in Gennep, Limburg
Areal
Ca. 80 m2
Pris pr. md.
Ca. 2,000 EUR per month
Område
Gennep, Limburg
Type
Office space
Commercial space in Gennep, Limburg
 More info
Commercial space in Gennep, Limburg
Commercial space for rent in Gennep, Limburg
Areal
Ca. 1,205 m2
Pris pr. md.
Ca. 6,250 EUR per month
Område
Gennep, Limburg
Type
Commercial property
Office space in Gennep, Limburg
 More info
Office space in Gennep, Limburg
Office space for rent in Gennep, Limburg
Areal
40 - 1,100 m2
Pris pr. md.
Not stated
Område
Gennep, Limburg
Type
Office space
Commercial space in Gennep, Limburg
 More info
Commercial space in Gennep, Limburg
Commercial space for rent in Gennep, Limburg
Areal
Ca. 165 m2
Pris pr. md.
Ca. 1,100 EUR per month
Område
Gennep, Limburg
Type
Commercial property
Restaurant in Gennep, Limburg
 More info
Restaurant in Gennep, Limburg
Horeca pand te huur in Gennep, Limburg
Areal
Ca. 130 m2
Pris pr. md.
Ca. 1,700 EUR per month
Område
Gennep, Limburg
Type
Restaurant
Shop in Gennep, Limburg
 More info
Shop in Gennep, Limburg
Shop for rent in Gennep, Limburg
Areal
Ca. 170 m2
Pris pr. md.
Ca. 1,800 EUR per month
Område
Gennep, Limburg
Type
Shop
Shop in Gennep, Limburg
More info
Shop in Gennep, Limburg
Shop for rent in Gennep, Limburg
Areal
140 - 300 m2
Pris pr. md.
Ca. 3,150 EUR per month
Område
Gennep, Limburg
Type
Shop
Commercial space in Gennep, Limburg
 More info
Commercial space in Gennep, Limburg
Commercial space te huur in Gennep, Limburg
Areal
Ca. 300 m2
Pris pr. md.
Not stated
Område
Gennep, Limburg
Type
Commercial property
Commercial space in Gennep, Limburg
 More info
Commercial space in Gennep, Limburg
Commercial space for rent in Gennep, Limburg
Areal
Ca. 510 m2
Pris pr. md.
Not stated
Område
Gennep, Limburg
Type
Commercial property
Office space in Gennep, Limburg
 More info
Office space in Gennep, Limburg
Office space for rent in Gennep, Limburg
Areal
Ca. 510 m2
Pris pr. md.
Not stated
Område
Gennep, Limburg
Type
Office space
Selected customers
Selected customers
30,000 customers use Companyspace.com
30,000 customers
285,000 companies in our database
2,400 rentals annually
Companyspace.com is used by thousands of landlords, property companies, commercial real estate agents, investors and business centres seeking greater visibility, more enquiries and lower vacancy rates.


