Available office spaces in Gelderland
See all available office spaces in Gelderland below. If you are looking for office space in Gelderland, you have come to the right place. We have most available office spaces in Gelderland in our database. Find office space in Gelderland here. Enjoy.
609 office spaces found
-
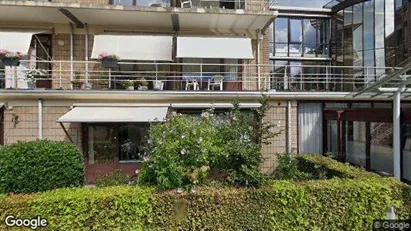
240 m2 office space for rent in Ede, Gelderland
- 1,662 EUR per month
- 83.12 EUR /m2/year
-
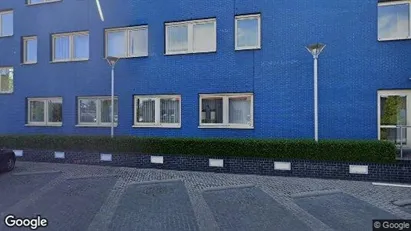
1602 m2 office space for rent in Arnhem, Gelderland
- 11,667 EUR per month
- 87.39 EUR /m2/year
-
91 m2 office space for rent in Arnhem, Gelderland
- 1,750 EUR per month
- 230.77 EUR /m2/year
-
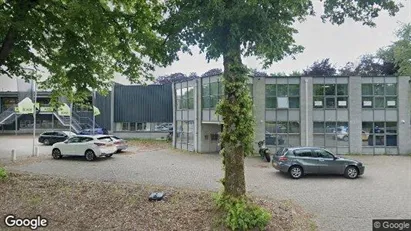
40 m2 office space for rent in Renkum, Gelderland
- 650 EUR per month
- 195 EUR /m2/year
-
253 m2 office space for rent in Duiven, Gelderland
- 1,875 EUR per month
- 88.93 EUR /m2/year
-
170 m2 office space for rent in Arnhem, Gelderland
- 2,167 EUR per month
- 152.94 EUR /m2/year
Frequently asked questions
Statistics on the development of available office spaces for rent in Gelderland over the past month
Also see aggregate statistics on all available office spaces in Gelderland over time, aggregate statistics on new office spaces in Gelderland over time, aggregate statistics on rented office spaces in Gelderland over time
| Date | |||
|---|---|---|---|
| 9. October 2025 | 619 | 7 | 0 |
| 8. October 2025 | 612 | 30 | 29 |
| 7. October 2025 | 611 | 15 | 0 |
| 6. October 2025 | 596 | 0 | 7 |
| 5. October 2025 | 603 | 7 | 8 |
| 4. October 2025 | 604 | 8 | 9 |
| 3. October 2025 | 605 | 5 | 0 |
| 2. October 2025 | 600 | 15 | 25 |
| 1. October 2025 | 610 | 17 | 7 |
| 30. September 2025 | 600 | 11 | 0 |
| 29. September 2025 | 589 | 0 | 17 |
| 28. September 2025 | 606 | 9 | 9 |
| 27. September 2025 | 606 | 28 | 37 |
| 26. September 2025 | 615 | 16 | 0 |
| 25. September 2025 | 599 | 0 | 0 |
| 24. September 2025 | 599 | 14 | 0 |
| 23. September 2025 | 585 | 4 | 20 |
| 22. September 2025 | 601 | 8 | 4 |
| 21. September 2025 | 597 | 10 | 10 |
| 20. September 2025 | 597 | 12 | 6 |
| 19. September 2025 | 591 | 11 | 0 |
| 18. September 2025 | 580 | 4 | 16 |
| 17. September 2025 | 592 | 23 | 8 |
| 16. September 2025 | 577 | 6 | 13 |
| 15. September 2025 | 584 | 4 | 12 |
| 14. September 2025 | 592 | 5 | 7 |
| 13. September 2025 | 594 | 8 | 4 |
| 12. September 2025 | 590 | 9 | 15 |
| 11. September 2025 | 596 | 13 | 14 |
| 10. September 2025 | 597 | 6 | 6 |
| 9. September 2025 | 597 | 13 | 0 |
Statistics on currently available office spaces in Gelderland in The Netherlands
Also see gathered statistics of all available office spaces in Gelderland over time, the gathered statistics of new office spaces in Gelderland over time, the gathered statistics of rented office spaces in Gelderland over time
| Office spaces | |
|---|---|
| Available premises | 608 |
| New premises since yesterday | 7 |
| Rented out premises since yesterday | 0 |
| Total available m2 | 310,194 |
| Average price per m2 per year without expenses | 666 |
| Highest price per m2 per year | 160,000 |
| Lowest price per m2 per year | 1.01 |


