


Commercial propertiesin Gelderland
Companyspace.com today:
New today 1,124
Updated 24h 1,128
Notifications about new companyspaces1,932
Copenhagen +4
Stockholm +3
Berlin +19
Oslo +1
Brussels +5
Warsaw +13
Latest update 52 min ago
Active ads 318,886
546 commercial properties found
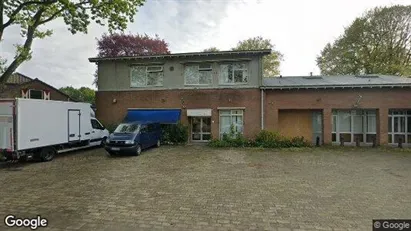
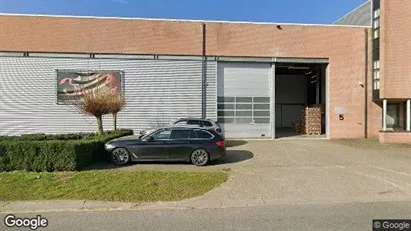
Commercial space in Wijchen, Gelderland
 More info
Commercial space in Wijchen, Gelderland
Totale opp. 300m2.
Magazijn / werkplaats 120m2 met grote elektrische roldeur.
3 kantoren 32m2, 38m2, 40m2
server / opslag 32m2
kantine 22m2
6 eigen par...
Areal
Ca. 300 m2
Pris pr. md.
Ca. 1,500 EUR pr md
Område
Wijchen, Gelderland
Type
Commercial property
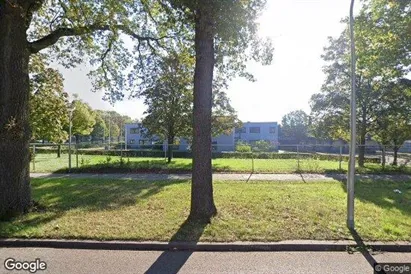
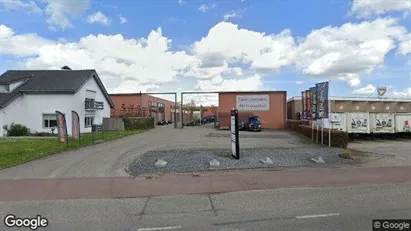
Commercial space in Ede, Gelderland
 More info
Commercial space in Ede, Gelderland
Wij bieden per direct diverse kantoorruimtes aan de Noordelijke Spoorstraat 15 in Ede. De beschikbare ruimtes variëren in grootte van 8 m² tot 65 m², waardoo...
Areal
Ca. 65 m2
Pris pr. md.
Not stated
Område
Ede, Gelderland
Type
Commercial property
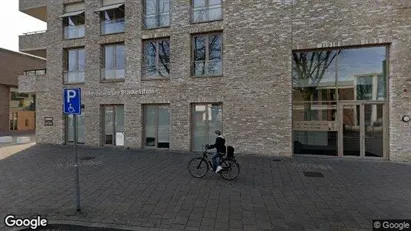
Commercial space in Nijmegen, Gelderland
 More info
Commercial space in Nijmegen, Gelderland
Commercial space for rent in Nijmegen, Gelderland
Areal
Ca. 2,000 m2
Pris pr. md.
Not stated
Område
Nijmegen, Gelderland
Type
Commercial property
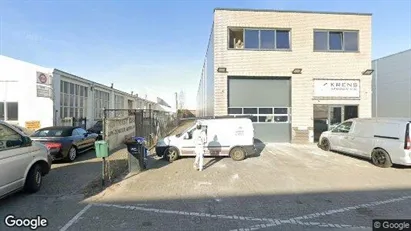
Commercial space in Wijchen, Gelderland
 More info
Commercial space in Wijchen, Gelderland
Commercial space for rent in Wijchen, Gelderland
Areal
Ca. 115 m2
Pris pr. md.
Ca. 1,600 EUR pr md
Område
Wijchen, Gelderland
Type
Commercial property
Commercial space in Nijmegen, Gelderland
 More info
Commercial space in Nijmegen, Gelderland
Commercial space for rent in Nijmegen, Gelderland
Areal
Ca. 250 m2
Pris pr. md.
Ca. 3,150 EUR pr md
Område
Nijmegen, Gelderland
Type
Commercial property
Commercial space in Beuningen, Gelderland
 More info
Commercial space in Beuningen, Gelderland
Commercial space for rent in Beuningen, Gelderland
Areal
Ca. 120 m2
Pris pr. md.
Ca. 850 EUR pr md
Område
Beuningen, Gelderland
Type
Commercial property
Commercial space in Wijchen, Gelderland
 More info
Commercial space in Wijchen, Gelderland
Commercial space for rent in Wijchen, Gelderland
Areal
Ca. 160 m2
Pris pr. md.
Ca. 1,250 EUR pr md
Område
Wijchen, Gelderland
Type
Commercial property
Commercial space in Nijmegen, Gelderland
 More info
Commercial space in Nijmegen, Gelderland
Commercial space for rent in Nijmegen, Gelderland
Areal
Ca. 11,380 m2
Pris pr. md.
Not stated
Område
Nijmegen, Gelderland
Type
Commercial property
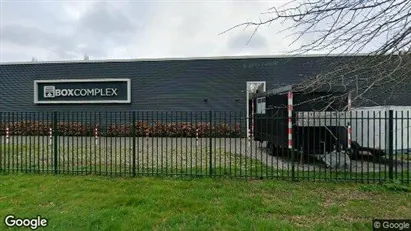
Commercial space in Tiel, Gelderland
 More info
Commercial space in Tiel, Gelderland
Boxcomplex Tiel is met twee complexen gunstig gelegen op bedrijventerrein Latenstein. Voor beide complexen is de bereikbaarheid uitstekend, de locaties zijn ...
Areal
Ca. 20 m2
Pris pr. md.
Ca. 8,350 EUR pr md
Område
Tiel, Gelderland
Type
Commercial property
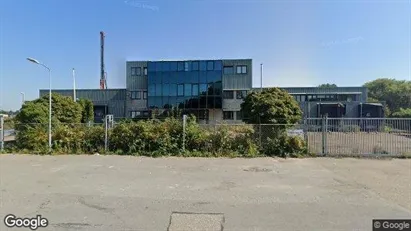
Commercial space in Tiel, Gelderland
 More info
Commercial space in Tiel, Gelderland
Commercial space for rent in Tiel, Gelderland
Areal
Ca. 3,180 m2
Pris pr. md.
Ca. 2,950,000 EUR pr md
Område
Tiel, Gelderland
Type
Commercial property
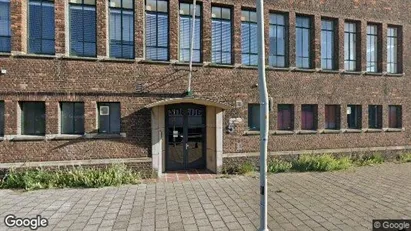
Commercial space in Arnhem, Gelderland
 More info
Commercial space in Arnhem, Gelderland
Commercial space for rent in Arnhem, Gelderland
Areal
Ca. 65 m2
Pris pr. md.
Ca. 1,600 EUR pr md
Område
Arnhem, Gelderland
Type
Commercial property
Commercial space in Nijmegen, Gelderland
 More info
Commercial space in Nijmegen, Gelderland
Commercial space for rent in Nijmegen, Gelderland
Areal
Ca. 875 m2
Pris pr. md.
Ca. 3,950 EUR pr md
Område
Nijmegen, Gelderland
Type
Commercial property
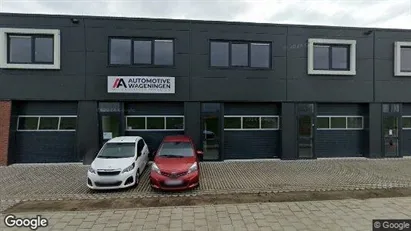
Commercial space in Wageningen, Gelderland
 More info
Commercial space in Wageningen, Gelderland
Commercial space for rent in Wageningen, Gelderland
Areal
Ca. 100 m2
Pris pr. md.
Ca. 215,000 EUR pr md
Område
Wageningen, Gelderland
Type
Commercial property
Commercial space in Overbetuwe, Gelderland
 More info
Commercial space in Overbetuwe, Gelderland
Commercial space for rent in Overbetuwe, Gelderland
Areal
Ca. 1,715 m2
Pris pr. md.
Ca. 10,550 EUR pr md
Område
Overbetuwe, Gelderland
Type
Commercial property
Commercial property in Culemborg, Gelderland
 More info
Commercial property in Culemborg, Gelderland
Commercial property for sale in Culemborg, Gelderland
Areal
-
Pris
Ca. 195,000EUR
Område
Culemborg, Gelderland
Type
Commercial property
Commercial space in Maasdriel, Gelderland
 More info
Commercial space in Maasdriel, Gelderland
Commercial space for rent in Maasdriel, Gelderland
Areal
Ca. 225 m2
Pris pr. md.
Ca. 1,500 EUR pr md
Område
Maasdriel, Gelderland
Type
Commercial property
Commercial space in Barneveld, Gelderland
 More info
Commercial space in Barneveld, Gelderland
Commercial space for rent in Barneveld, Gelderland
Areal
Ca. 290 m2
Pris pr. md.
Ca. 1,350 EUR pr md
Område
Barneveld, Gelderland
Type
Commercial property
Commercial space in Wijchen, Gelderland
 More info
Commercial space in Wijchen, Gelderland
Commercial space te huur in Wijchen, Gelderland
Areal
Ca. 13,845 m2
Pris pr. md.
Ca. 60,400 EUR pr md
Område
Wijchen, Gelderland
Type
Commercial property
Selected customers
30,000 customers use Companyspace.com
30,000 customers
285,000 companies in our database
2,400 rentals annually
Companyspace.com is used by thousands of landlords, property companies, commercial real estate agents, investors and business centres seeking greater visibility, more enquiries and lower vacancy rates.


