


Industrial properties in De Wolden
These commercial premises are closest to your search
We currently have no available commercial premises registered that match your search exactly. Therefore, we show below the commercial premises that best match your search based on the current market.
The shown listings may differ from your original search in terms of, for example, premises type, location, size or price, but they have been selected because they may be relevant alternatives for your business.
Take a look at the suggestions below – or start your search again here.
Companyspace.com today:
New today 780
Updated 24h 1,773
Notifications about new companyspaces74
Copenhagen +1
Stockholm +1
Amsterdam +3
Berlin +3
Brussels +6
Vienna +16
Paris +1
Madrid +12
Dublin (county) +11
Warsaw +7
Roma (region) +3
Lisbon +1
Latest update 1 min ago
Active ads 364,828
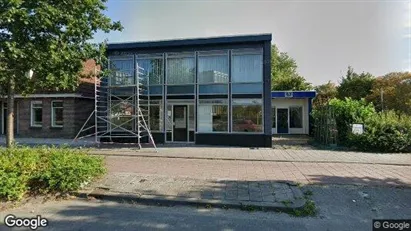
Clinic in Emmen, Drenthe
 More info
Clinic in Emmen, Drenthe
Verzamelpand op zorg gericht maar mag breder
Areal
Ca. 200 m2
Pris pr. md.
Ca. 300 EUR per month
Område
Emmen, Drenthe
Type
Clinic
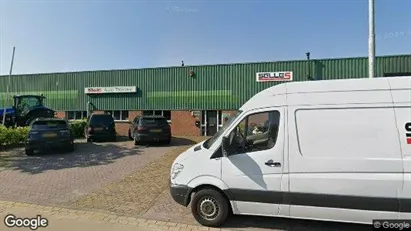
Industrial property in Hoogeveen, Drenthe
 More info
Industrial property in Hoogeveen, Drenthe
Industrial property for rent in Hoogeveen, Drenthe
Areal
-
Pris pr. md.
Ca. 1,750 EUR per month
Område
Hoogeveen, Drenthe
Type
Industrial property
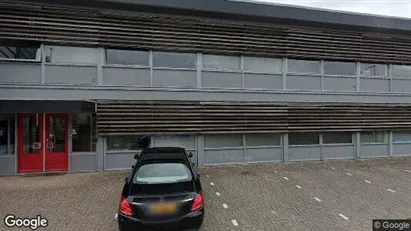
Restaurant in Assen, Drenthe
 More info
Restaurant in Assen, Drenthe
Horeca pand te huur in Assen, Drenthe
Areal
Ca. 150 m2
Pris pr. md.
Ca. 2,500 EUR per month
Område
Assen, Drenthe
Type
Restaurant
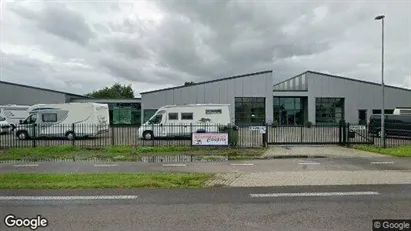
Industrial property in Hoogeveen, Drenthe
 More info
Industrial property in Hoogeveen, Drenthe
Industrial property for rent in Hoogeveen, Drenthe
Areal
-
Pris pr. md.
Ca. 850 EUR per month
Område
Hoogeveen, Drenthe
Type
Industrial property
Industrial property in Hoogeveen, Drenthe
 More info
Industrial property in Hoogeveen, Drenthe
Industrial property for rent in Hoogeveen, Drenthe
Areal
-
Pris pr. md.
Ca. 850 EUR per month
Område
Hoogeveen, Drenthe
Type
Industrial property
Industrial property in Hoogeveen, Drenthe
 More info
Industrial property in Hoogeveen, Drenthe
Industrial property for rent in Hoogeveen, Drenthe
Areal
-
Pris pr. md.
Ca. 50 EUR per month
Område
Hoogeveen, Drenthe
Type
Industrial property
Industrial property in Hoogeveen, Drenthe
 More info
Industrial property in Hoogeveen, Drenthe
Industrial property for rent in Hoogeveen, Drenthe
Areal
-
Pris pr. md.
Ca. 800 EUR per month
Område
Hoogeveen, Drenthe
Type
Industrial property
Office space in Hoogeveen, Drenthe
 More info
Office space in Hoogeveen, Drenthe
Office space for rent in Hoogeveen, Drenthe
Areal
-
Pris pr. md.
Ca. 2,000 EUR per month
Område
Hoogeveen, Drenthe
Type
Office space
Commercial space in Midden-Drenthe, Drenthe
 More info
Commercial space in Midden-Drenthe, Drenthe
Commercial space for rent in Midden-Drenthe, Drenthe
Areal
Ca. 2,080 m2
Pris pr. md.
Ca. 5,500 EUR per month
Område
Midden-Drenthe, Drenthe
Type
Commercial property
Commercial property in Hoogeveen, Drenthe
 More info
Commercial property in Hoogeveen, Drenthe
Commercial property for sale in Hoogeveen, Drenthe
Areal
Ca. 800 m2
Pris
Ca. 580,000EUR
Område
Hoogeveen, Drenthe
Type
Commercial property
Commercial space in Borger-Odoorn, Drenthe
 More info
Commercial space in Borger-Odoorn, Drenthe
Commercial space for rent in Borger-Odoorn, Drenthe
Areal
Ca. 485 m2
Pris pr. md.
Ca. 2,000 EUR per month
Område
Borger-Odoorn, Drenthe
Type
Commercial property
Commercial property in Emmen, Drenthe
 More info
Commercial property in Emmen, Drenthe
Commercial property for sale in Emmen, Drenthe
Areal
Ca. 2,125 m2
Pris
Ca. 795,000EUR
Område
Emmen, Drenthe
Type
Commercial property
Commercial space in Midden-Drenthe, Drenthe
 More info
Commercial space in Midden-Drenthe, Drenthe
Commercial space for rent in Midden-Drenthe, Drenthe
Areal
Ca. 860 m2
Pris pr. md.
Ca. 389,000 EUR per month
Område
Midden-Drenthe, Drenthe
Type
Commercial property
Commercial space in Emmen, Drenthe
 More info
Commercial space in Emmen, Drenthe
Commercial space for rent in Emmen, Drenthe
Areal
Ca. 700 m2
Pris pr. md.
Not stated
Område
Emmen, Drenthe
Type
Commercial property
Office space in Assen, Drenthe
 More info
Office space in Assen, Drenthe
Office space for rent in Assen, Drenthe
Areal
Ca. 25 m2
Pris pr. md.
Ca. 700 EUR per month
Område
Assen, Drenthe
Type
Office space
Office space in Assen, Drenthe
 More info
Office space in Assen, Drenthe
Office space for rent in Assen, Drenthe
Areal
Ca. 20 m2
Pris pr. md.
Ca. 550 EUR per month
Område
Assen, Drenthe
Type
Office space
Commercial property in Emmen, Drenthe
 More info
Commercial property in Emmen, Drenthe
Commercial property te koop in Emmen, Drenthe
Areal
-
Pris
Ca. 800,000EUR
Område
Emmen, Drenthe
Type
Commercial property
Commercial space in Emmen, Drenthe
 More info
Commercial space in Emmen, Drenthe
Commercial space for rent in Emmen, Drenthe
Areal
Ca. 850 m2
Pris pr. md.
Not stated
Område
Emmen, Drenthe
Type
Commercial property
Selected customers


