


Industrial properties in Finland
Companyspace.com today:
New today 1,071
Updated 24h 1,569
Notifications about new companyspaces1,391
Copenhagen +2
Stockholm +4
Amsterdam +1
Berlin +7
Oslo +2
Brussels +13
Vienna +31
Paris +5
Dublin (county) +36
Warsaw +36
Latest update 30 min ago
Active ads 360,584
2,976 industrial properties found
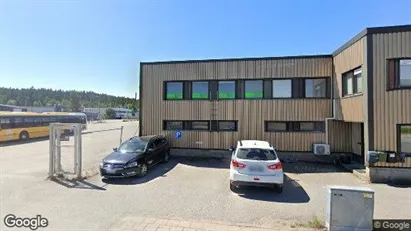
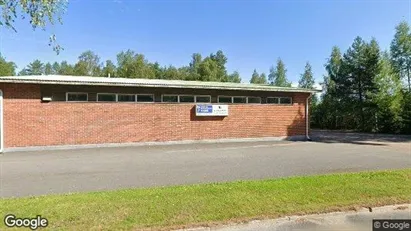
Industrial property in Sotkamo, Kainuu
 More info
Industrial property in Sotkamo, Kainuu
Industrial property for rent in Sotkamo, Kainuu
Areal
58 - 116 m2
Pris pr. md.
Ca. 500 EUR pr md
Område
Sotkamo, Kainuu
Type
Industrial property
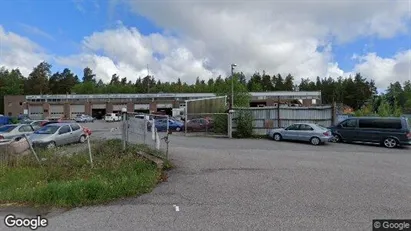
Industrial property in Helsinki Koillinen, Helsinki
 More info
Industrial property in Helsinki Koillinen, Helsinki
Industrial property for rent in Helsinki Koillinen, Helsinki
Areal
Ca. 360 m2
Pris pr. md.
Ca. 800 EUR pr md
Område
Helsinki Koillinen, Helsinki
Type
Industrial property
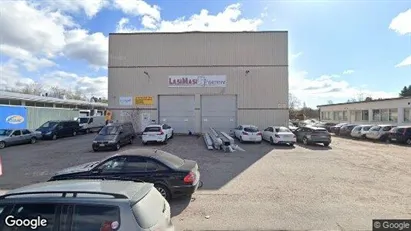
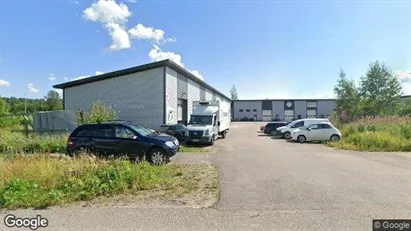
Industrial property in Turku, Varsinais-Suomi
 More info
Industrial property in Turku, Varsinais-Suomi
Industrial property for rent in Turku, Varsinais-Suomi
Areal
Ca. 600 m2
Pris pr. md.
Ca. 4,150 EUR pr md
Område
Turku, Varsinais-Suomi
Type
Industrial property
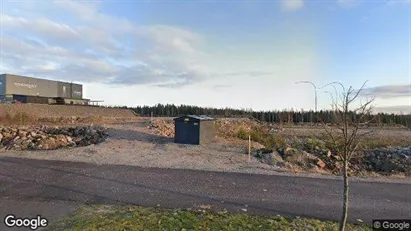
Industrial property in Sipoo, Uusimaa
 More info
Industrial property in Sipoo, Uusimaa
Industrial property for rent in Sipoo, Uusimaa
Areal
Ca. 70 m2
Pris pr. md.
Ca. 800 EUR pr md
Område
Sipoo, Uusimaa
Type
Industrial property
Industrial property in Raisio, Varsinais-Suomi
 More info
Industrial property in Raisio, Varsinais-Suomi
Industrial property for rent in Raisio, Varsinais-Suomi
Areal
Ca. 140 m2
Pris pr. md.
Ca. 900 EUR pr md
Område
Raisio, Varsinais-Suomi
Type
Industrial property
Industrial property in Nurmijärvi, Uusimaa
 More info
Industrial property in Nurmijärvi, Uusimaa
Industrial property for rent in Nurmijärvi, Uusimaa
Areal
Ca. 200 m2
Pris pr. md.
Ca. 1,700 EUR pr md
Område
Nurmijärvi, Uusimaa
Type
Industrial property
Industrial property in Lahti, Päijät-Häme
 More info
Industrial property in Lahti, Päijät-Häme
Industrial property for rent in Lahti, Päijät-Häme
Areal
Ca. 250 m2
Pris pr. md.
Ca. 1,500 EUR pr md
Område
Lahti, Päijät-Häme
Type
Industrial property
Industrial property in Hyvinkää, Uusimaa
 More info
Industrial property in Hyvinkää, Uusimaa
Industrial property for rent in Hyvinkää, Uusimaa
Areal
Ca. 390 m2
Pris pr. md.
Ca. 1,600 EUR pr md
Område
Hyvinkää, Uusimaa
Type
Industrial property
Industrial property in Helsinki Koillinen, Helsinki
 More info
Industrial property in Helsinki Koillinen, Helsinki
Industrial property for rent in Helsinki Koillinen, Helsinki
Areal
Ca. 200 m2
Pris pr. md.
Ca. 2,200 EUR pr md
Område
Helsinki Koillinen, Helsinki
Type
Industrial property
Industrial property in Nurmijärvi, Uusimaa
 More info
Industrial property in Nurmijärvi, Uusimaa
Industrial property for rent in Nurmijärvi, Uusimaa
Areal
Ca. 65 m2
Pris pr. md.
Ca. 850 EUR pr md
Område
Nurmijärvi, Uusimaa
Type
Industrial property
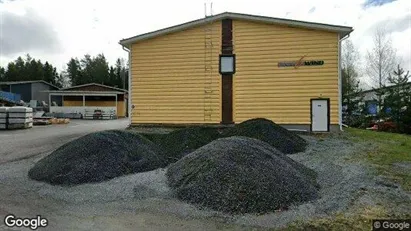
Industrial property in Keminmaa, Lappi
 More info
Industrial property in Keminmaa, Lappi
Industrial property for rent in Keminmaa, Lappi
Areal
-
Pris pr. md.
Ca. 2,600 EUR pr md
Område
Keminmaa, Lappi
Type
Industrial property
Industrial property in Kankaanpää, Satakunta
 More info
Industrial property in Kankaanpää, Satakunta
Industrial property for rent in Kankaanpää, Satakunta
Areal
Ca. 165 m2
Pris pr. md.
Ca. 550 EUR pr md
Område
Kankaanpää, Satakunta
Type
Industrial property
Industrial property in Lieto, Varsinais-Suomi
 More info
Industrial property in Lieto, Varsinais-Suomi
Industrial property for rent in Lieto, Varsinais-Suomi
Areal
Ca. 575 m2
Pris pr. md.
Ca. 3,350 EUR pr md
Område
Lieto, Varsinais-Suomi
Type
Industrial property
Industrial property in Hyvinkää, Uusimaa
 More info
Industrial property in Hyvinkää, Uusimaa
Industrial property for rent in Hyvinkää, Uusimaa
Areal
Ca. 370 m2
Pris pr. md.
Ca. 4,000 EUR pr md
Område
Hyvinkää, Uusimaa
Type
Industrial property
Industrial property in Vihti, Uusimaa
 More info
Industrial property in Vihti, Uusimaa
Industrial property for rent in Vihti, Uusimaa
Areal
Ca. 100 m2
Pris pr. md.
Ca. 900 EUR pr md
Område
Vihti, Uusimaa
Type
Industrial property
Industrial property in Lempäälä, Pirkanmaa
 More info
Industrial property in Lempäälä, Pirkanmaa
Industrial property for rent in Lempäälä, Pirkanmaa
Areal
Ca. 210 m2
Pris pr. md.
Not stated
Område
Lempäälä, Pirkanmaa
Type
Industrial property
Warehouse in Tornio, Lappi
 More info
Warehouse in Tornio, Lappi
Warehouse for rent in Tornio, Lappi
Areal
-
Pris pr. md.
Ca. 1,400 EUR pr md
Område
Tornio, Lappi
Type
Warehouse
Industrial property in Lieto, Varsinais-Suomi
 More info
Industrial property in Lieto, Varsinais-Suomi
Industrial property for rent in Lieto, Varsinais-Suomi
Areal
Ca. 300 m2
Pris pr. md.
Ca. 2,300 EUR pr md
Område
Lieto, Varsinais-Suomi
Type
Industrial property
Selected customers
30,000 customers use Companyspace.com
30,000 customers
285,000 companies in our database
2,400 rentals annually
Companyspace.com is used by thousands of landlords, property companies, commercial real estate agents, investors and business centres seeking greater visibility, more enquiries and lower vacancy rates.


