


Industrial properties in Finland
Companyspace.com today:
New today 495
Updated 24h 501
Notifications about new companyspaces1,767
Copenhagen +3
Stockholm +2
Brussels +5
Warsaw +1
Latest update 2 min ago
Active ads 307,493
2,998 industrial properties found
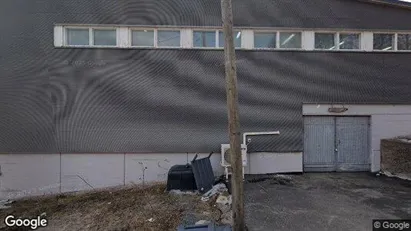
Industrial property in Helsinki Koillinen, Helsinki
 More info
Industrial property in Helsinki Koillinen, Helsinki
Industrial property for rent in Helsinki Koillinen, Helsinki
Areal
Ca. 320 m2
Pris pr. md.
Ca. 1,950 EUR pr md
Område
Helsinki Koillinen, Helsinki
Type
Industrial property
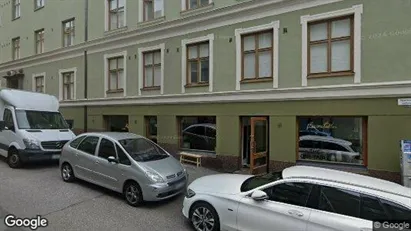
Industrial property in Helsinki Koillinen, Helsinki
 More info
Industrial property in Helsinki Koillinen, Helsinki
Industrial property for rent in Helsinki Koillinen, Helsinki
Areal
Ca. 600 m2
Pris pr. md.
Ca. 6,600 EUR pr md
Område
Helsinki Koillinen, Helsinki
Type
Industrial property
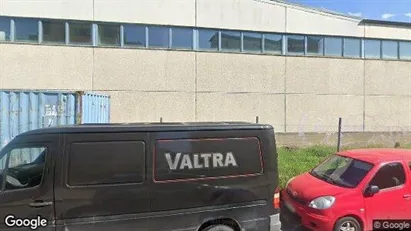
Industrial property in Helsinki Koillinen, Helsinki
 More info
Industrial property in Helsinki Koillinen, Helsinki
Industrial property for rent in Helsinki Koillinen, Helsinki
Areal
Ca. 160 m2
Pris pr. md.
Ca. 2,400 EUR pr md
Område
Helsinki Koillinen, Helsinki
Type
Industrial property
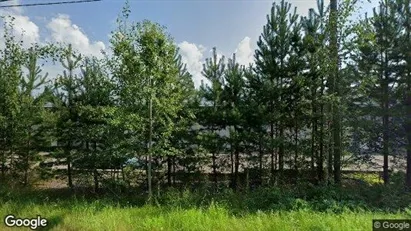
Industrial property in Hyvinkää, Uusimaa
 More info
Industrial property in Hyvinkää, Uusimaa
Industrial property for rent in Hyvinkää, Uusimaa
Areal
Ca. 155 m2
Pris pr. md.
Ca. 1,150 EUR pr md
Område
Hyvinkää, Uusimaa
Type
Industrial property
Industrial property in Helsinki Eteläinen, Helsinki
 More info
Industrial property in Helsinki Eteläinen, Helsinki
Industrial property for rent in Helsinki Eteläinen, Helsinki
Areal
Ca. 85 m2
Pris pr. md.
Ca. 1,000 EUR pr md
Område
Helsinki Eteläinen, Helsinki
Type
Industrial property
Industrial property in Helsinki Koillinen, Helsinki
 More info
Industrial property in Helsinki Koillinen, Helsinki
Industrial property for rent in Helsinki Koillinen, Helsinki
Areal
Ca. 40 m2
Pris pr. md.
Ca. 400 EUR pr md
Område
Helsinki Koillinen, Helsinki
Type
Industrial property
Industrial property in Helsinki Koillinen, Helsinki
 More info
Industrial property in Helsinki Koillinen, Helsinki
Industrial property for rent in Helsinki Koillinen, Helsinki
Areal
Ca. 185 m2
Pris pr. md.
Ca. 1,350 EUR pr md
Område
Helsinki Koillinen, Helsinki
Type
Industrial property
Industrial property in Lohja, Uusimaa
 More info
Industrial property in Lohja, Uusimaa
Industrial property for rent in Lohja, Uusimaa
Areal
Ca. 70 m2
Pris pr. md.
Ca. 750 EUR pr md
Område
Lohja, Uusimaa
Type
Industrial property
Industrial property in Helsinki Koillinen, Helsinki
 More info
Industrial property in Helsinki Koillinen, Helsinki
Industrial property for rent in Helsinki Koillinen, Helsinki
Areal
Ca. 190 m2
Pris pr. md.
Ca. 1,800 EUR pr md
Område
Helsinki Koillinen, Helsinki
Type
Industrial property
Industrial property in Helsinki Läntinen, Helsinki
 More info
Industrial property in Helsinki Läntinen, Helsinki
Industrial property for rent in Helsinki Läntinen, Helsinki
Areal
Ca. 650 m2
Pris pr. md.
Ca. 6,200 EUR pr md
Område
Helsinki Läntinen, Helsinki
Type
Industrial property
Industrial property in Helsinki Keskinen, Helsinki
 More info
Industrial property in Helsinki Keskinen, Helsinki
Industrial property for rent in Helsinki Keskinen, Helsinki
Areal
Ca. 500 m2
Pris pr. md.
Ca. 5,500 EUR pr md
Område
Helsinki Keskinen, Helsinki
Type
Industrial property
Industrial property in Helsinki Koillinen, Helsinki
 More info
Industrial property in Helsinki Koillinen, Helsinki
Industrial property for rent in Helsinki Koillinen, Helsinki
Areal
Ca. 130 m2
Pris pr. md.
Ca. 1,350 EUR pr md
Område
Helsinki Koillinen, Helsinki
Type
Industrial property
Industrial property in Vantaa, Uusimaa
 More info
Industrial property in Vantaa, Uusimaa
Industrial property for rent in Vantaa, Uusimaa
Areal
100 - 1,000 m2
Pris pr. md.
Ca. 2,000 EUR pr md
Område
Vantaa, Uusimaa
Type
Industrial property
Industrial property in Helsinki Keskinen, Helsinki
 More info
Industrial property in Helsinki Keskinen, Helsinki
Industrial property for rent in Helsinki Keskinen, Helsinki
Areal
Ca. 80 m2
Pris pr. md.
Ca. 600 EUR pr md
Område
Helsinki Keskinen, Helsinki
Type
Industrial property
Industrial property in Helsinki Kaakkoinen, Helsinki
 More info
Industrial property in Helsinki Kaakkoinen, Helsinki
Industrial property for rent in Helsinki Kaakkoinen, Helsinki
Areal
Ca. 250 m2
Pris pr. md.
Ca. 3,000 EUR pr md
Område
Helsinki Kaakkoinen, Helsinki
Type
Industrial property
Industrial property in Lahti, Päijät-Häme
 More info
Industrial property in Lahti, Päijät-Häme
Industrial property for rent in Lahti, Päijät-Häme
Areal
Ca. 200 m2
Pris pr. md.
Ca. 1,250 EUR pr md
Område
Lahti, Päijät-Häme
Type
Industrial property
Industrial property in Kotka, Kymenlaakso
 More info
Industrial property in Kotka, Kymenlaakso
Industrial property for rent in Kotka, Kymenlaakso
Areal
Ca. 215 m2
Pris pr. md.
Ca. 2,000 EUR pr md
Område
Kotka, Kymenlaakso
Type
Industrial property
Industrial property in Tuusula, Uusimaa
 More info
Industrial property in Tuusula, Uusimaa
Industrial property for rent in Tuusula, Uusimaa
Areal
Ca. 55 m2
Pris pr. md.
Ca. 600 EUR pr md
Område
Tuusula, Uusimaa
Type
Industrial property
Selected customers
30,000 customers use Companyspace.com
30,000 customers
285,000 companies in our database
2,400 rentals annually
Companyspace.com is used by thousands of landlords, property companies, commercial real estate agents, investors and business centres seeking greater visibility, more enquiries and lower vacancy rates.


