


Commercial property for renton Funen
There are 111 available commercial propertieson Funen right now. Companyspace.com collects commercial properties from many different parts of the market, so that you as a company can more easily get an overview of available commercial propertieson Funen.
Companyspace.com today:
New today 1,122
Updated 24h 1,123
Notifications about new companyspaces2,019
Copenhagen +55
Stockholm +5
Amsterdam +29
Berlin +2
Brussels +3
Vienna +37
Paris +7
Madrid +4
Dublin (county) +4
Warsaw +7
Roma (region) +1
Latest update 12 min ago
Active ads 365,819
111 commercial properties found
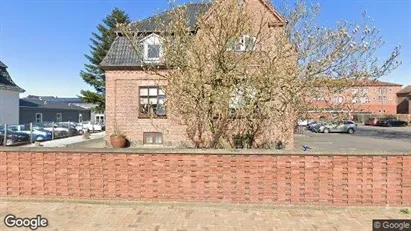
Commercial space in Svendborg, Funen
 More info
Commercial space in Svendborg, Funen
Commercial space for rent in Svendborg, Funen
Areal
-
Pris pr. md.
Not stated
Område
Svendborg, Funen
Type
Commercial property
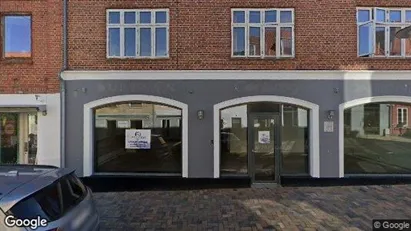
Commercial space in Svendborg, Funen
 More info
Commercial space in Svendborg, Funen
Commercial space for rent in Svendborg, Funen
Areal
-
Pris pr. md.
Not stated
Område
Svendborg, Funen
Type
Commercial property
Commercial space in Svendborg, Funen
 More info
Commercial space in Svendborg, Funen
Commercial space for rent in Svendborg, Funen
Areal
Ca. 875 m2
Pris pr. md.
Not stated
Område
Svendborg, Funen
Type
Commercial property
Commercial space in Faaborg, Funen
 More info
Commercial space in Faaborg, Funen
Commercial space for rent in Faaborg, Funen
Areal
-
Pris pr. md.
Not stated
Område
Faaborg, Funen
Type
Commercial property
Commercial space in Svendborg, Funen
 More info
Commercial space in Svendborg, Funen
Commercial space for rent in Svendborg, Funen
Areal
Ca. 675 m2
Pris pr. md.
Not stated
Område
Svendborg, Funen
Type
Commercial property
Commercial space in Odense C, Odense
 More info
Commercial space in Odense C, Odense
Commercial space for rent in Odense C, Odense
Areal
Ca. 10 m2
Pris pr. md.
Not stated
Område
Odense C, Odense
Type
Commercial property
Commercial space in Middelfart, Funen
 More info
Commercial space in Middelfart, Funen
Commercial space for rent in Middelfart, Funen
Areal
-
Pris pr. md.
Not stated
Område
Middelfart, Funen
Type
Commercial property
Commercial space in Ringe, Funen
 More info
Commercial space in Ringe, Funen
Commercial space for rent in Ringe, Funen
Areal
-
Pris pr. md.
Not stated
Område
Ringe, Funen
Type
Commercial property
Commercial space in Nyborg, Funen
 More info
Commercial space in Nyborg, Funen
Commercial space for rent in Nyborg, Funen
Areal
Ca. 1,030 m2
Pris pr. md.
Not stated
Område
Nyborg, Funen
Type
Commercial property
Commercial space in Odense C, Odense
 More info
Commercial space in Odense C, Odense
Commercial space for rent in Odense C, Odense
Areal
Ca. 270 m2
Pris pr. md.
Not stated
Område
Odense C, Odense
Type
Commercial property
Commercial space in Svendborg, Funen
 More info
Commercial space in Svendborg, Funen
Commercial space for rent in Svendborg, Funen
Areal
Ca. 310 m2
Pris pr. md.
Not stated
Område
Svendborg, Funen
Type
Commercial property
Commercial space in Svendborg, Funen
More info
Commercial space in Svendborg, Funen
Commercial space for rent in Svendborg, Funen
Areal
Ca. 450 m2
Pris pr. md.
Not stated
Område
Svendborg, Funen
Type
Commercial property
Commercial space in Svendborg, Funen
More info
Commercial space in Svendborg, Funen
Commercial space for rent in Svendborg, Funen
Areal
-
Pris pr. md.
Not stated
Område
Svendborg, Funen
Type
Commercial property
Commercial space in Middelfart, Funen
More info
Commercial space in Middelfart, Funen
Commercial space for rent in Middelfart, Funen
Areal
-
Pris pr. md.
Not stated
Område
Middelfart, Funen
Type
Commercial property
Commercial space in Odense C, Odense
More info
Commercial space in Odense C, Odense
Commercial space for rent in Odense C, Odense
Areal
-
Pris pr. md.
Not stated
Område
Odense C, Odense
Type
Commercial property
Commercial space in Odense M, Odense
More info
Commercial space in Odense M, Odense
Commercial space for rent in Odense M, Odense
Areal
-
Pris pr. md.
Not stated
Område
Odense M, Odense
Type
Commercial property
Commercial space in Svendborg, Funen
More info
Commercial space in Svendborg, Funen
Commercial space for rent in Svendborg, Funen
Areal
Ca. 10 m2
Pris pr. md.
Not stated
Område
Svendborg, Funen
Type
Commercial property
Commercial space in Svendborg, Funen
More info
Commercial space in Svendborg, Funen
Commercial space for rent in Svendborg, Funen
Areal
Ca. 3,740 m2
Pris pr. md.
Not stated
Område
Svendborg, Funen
Type
Commercial property
Selected customers
30,000 customers use Companyspace.com
30,000 customers
285,000 companies in our database
2,400 rentals annually
Companyspace.com is used by thousands of landlords, property companies, commercial real estate agents, investors and business centres seeking greater visibility, more enquiries and lower vacancy rates.


