


Commercial premises for rent in Slangerup
There are 38 available commercial properties in Slangerup right now. Companyspace.com collects commercial properties from many different parts of the market, so that you as a company can more easily get an overview of available commercial properties in Slangerup.
Companyspace.com today:
New today 2,864
Updated 24h 4,138
Notifications about new companyspaces1,228
Berlin +3
Paris +5
Madrid +4
Dublin (county) +23
Warsaw +19
Greater London +12
Latest update 26 min ago
Active ads 368,922
38 company spaces found
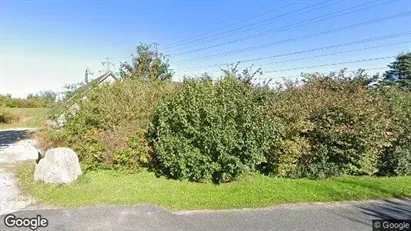
Industrial property in Slangerup, North Zealand
 More info
Industrial property in Slangerup, North Zealand
Industrial property for rent in Slangerup, North Zealand
Areal
Ca. 170 m2
Pris pr. md.
Ca. 8,800 DKK pr md
Område
Slangerup, North Zealand
Type
Industrial property
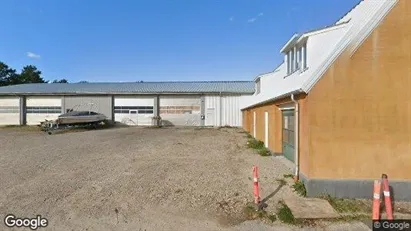
Warehouse in Slangerup, North Zealand
 More info
Warehouse in Slangerup, North Zealand
Warehouse for rent in Slangerup, North Zealand
Areal
Ca. 15,000 m2
Pris pr. md.
Ca. 781,250 DKK pr md
Område
Slangerup, North Zealand
Type
Warehouse
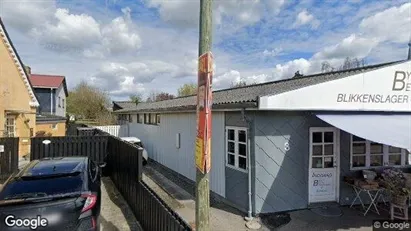
Office space in Slangerup, North Zealand
 More info
Office space in Slangerup, North Zealand
Office space for rent in Slangerup, North Zealand
Areal
Ca. 105 m2
Pris pr. md.
Ca. 6,000 DKK pr md
Område
Slangerup, North Zealand
Type
Office space
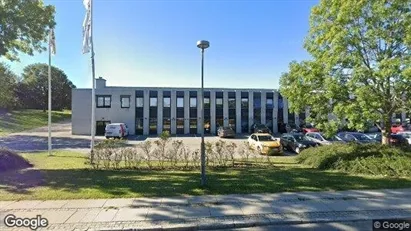
Warehouse in Slangerup, North Zealand
 More info
Warehouse in Slangerup, North Zealand
Warehouse for rent in Slangerup, North Zealand
Areal
550 - 3,550 m2
Pris pr. md.
Ca. 162,700 DKK pr md
Område
Slangerup, North Zealand
Type
Warehouse
Warehouse in Slangerup, North Zealand
 More info
Warehouse in Slangerup, North Zealand
Warehouse for rent in Slangerup, North Zealand
Areal
Ca. 200 m2
Pris pr. md.
Not stated
Område
Slangerup, North Zealand
Type
Warehouse
Office space in Slangerup, North Zealand
 More info
Office space in Slangerup, North Zealand
Office space for rent in Slangerup, North Zealand
Areal
Ca. 105 m2
Pris pr. md.
Ca. 6,000 DKK pr md
Område
Slangerup, North Zealand
Type
Office space
Warehouse in Slangerup, North Zealand
 More info
Warehouse in Slangerup, North Zealand
Warehouse for rent in Slangerup, North Zealand
Areal
Ca. 2,895 m2
Pris pr. md.
Ca. 132,650 DKK pr md
Område
Slangerup, North Zealand
Type
Warehouse
Office space in Slangerup, North Zealand
 More info
Office space in Slangerup, North Zealand
Office space for rent in Slangerup, North Zealand
Areal
Ca. 145 m2
Pris pr. md.
Ca. 8,450 DKK pr md
Område
Slangerup, North Zealand
Type
Office space
Industrial property in Slangerup, North Zealand
More info
We monitor the market!
Industrial property in Slangerup, North Zealand
Industrial property for rent in Slangerup, North Zealand
Areal
Ca. 170 m2
Pris pr. md.
Ca. 7,450 DKK pr md
Område
Slangerup, North Zealand
Type
Industrial property
Warehouse in Slangerup, North Zealand
More info
We monitor the market!
Warehouse in Slangerup, North Zealand
Warehouse for rent in Slangerup, North Zealand
Areal
Ca. 2,735 m2
Pris pr. md.
Ca. 96,950 DKK pr md
Område
Slangerup, North Zealand
Type
Warehouse
Office space in Slangerup, North Zealand
More info
We monitor the market!
Office space in Slangerup, North Zealand
Office space for rent in Slangerup, North Zealand
Areal
Ca. 1,240 m2
Pris pr. md.
Ca. 46,550 DKK pr md
Område
Slangerup, North Zealand
Type
Office space
Warehouse in Slangerup, North Zealand
More info
We monitor the market!
Warehouse in Slangerup, North Zealand
Warehouse for rent in Slangerup, North Zealand
Areal
Ca. 1,640 m2
Pris pr. md.
Ca. 61,600 DKK pr md
Område
Slangerup, North Zealand
Type
Warehouse
Office space in Slangerup, North Zealand
More info
We monitor the market!
Office space in Slangerup, North Zealand
Office space for rent in Slangerup, North Zealand
Areal
Ca. 665 m2
Pris pr. md.
Ca. 19,450 DKK pr md
Område
Slangerup, North Zealand
Type
Office space
Office space in Slangerup, North Zealand
More info
We monitor the market!
Office space in Slangerup, North Zealand
Office space for rent in Slangerup, North Zealand
Areal
Ca. 420 m2
Pris pr. md.
Ca. 15,750 DKK pr md
Område
Slangerup, North Zealand
Type
Office space
Office space in Slangerup, North Zealand
More info
We monitor the market!
Office space in Slangerup, North Zealand
Office space for rent in Slangerup, North Zealand
Areal
Ca. 1,485 m2
Pris pr. md.
Ca. 50,200 DKK pr md
Område
Slangerup, North Zealand
Type
Office space
Warehouse in Slangerup, North Zealand
 More info
Warehouse in Slangerup, North Zealand
Warehouse for rent in Slangerup, North Zealand
Areal
Ca. 200 m2
Pris pr. md.
Not stated
Område
Slangerup, North Zealand
Type
Warehouse
Office space in Slangerup, North Zealand
 More info
Office space in Slangerup, North Zealand
Office space for rent in Slangerup, North Zealand
Areal
Ca. 70 m2
Pris pr. md.
Not stated
Område
Slangerup, North Zealand
Type
Office space
Warehouse in Slangerup, North Zealand
 More info
Warehouse in Slangerup, North Zealand
Warehouse for rent in Slangerup, North Zealand
Areal
Ca. 425 m2
Pris pr. md.
Not stated
Område
Slangerup, North Zealand
Type
Warehouse
Selected customers
30,000 customers use Companyspace.com
30,000 customers
285,000 companies in our database
2,400 rentals annually
Companyspace.com is used by thousands of landlords, property companies, commercial real estate agents, investors and business centres seeking greater visibility, more enquiries and lower vacancy rates.


