


Commercial premises for rent in Slangerup
There are 38 available commercial properties in Slangerup right now. Companyspace.com collects commercial properties from many different parts of the market, so that you as a company can more easily get an overview of available commercial properties in Slangerup.
Companyspace.com today:
New today 1,777
Updated 24h 1,777
Notifications about new companyspaces1,798
Copenhagen +4
Stockholm +2
Amsterdam +10
Berlin +12
Brussels +5
Vienna +66
Paris +11
Madrid +1
Dublin (county) +7
Warsaw +18
Roma (region) +3
Lisbon +1
Greater London +4
Latest update 2 min ago
Active ads 366,300
38 company spaces found
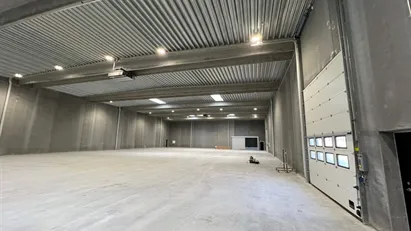
Warehouse in Slangerup, North Zealand
More info
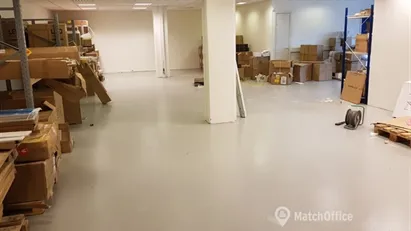

Warehouse in Slangerup, North Zealand
Warehouse for rent in Slangerup, North Zealand
Areal
200 - 442 m2
Pris pr. md.
Not stated
Område
Slangerup, North Zealand
Type
Warehouse
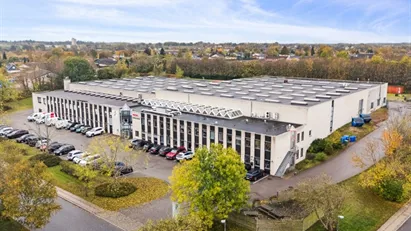
Warehouse in Slangerup, North Zealand
More info
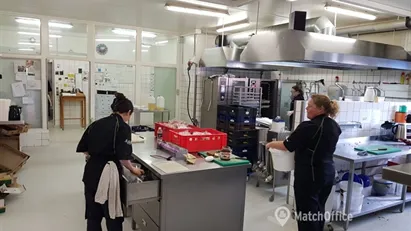
Warehouse in Slangerup, North Zealand
Warehouse for rent in Slangerup, North Zealand
Areal
440 m2
Pris pr. md.
Not stated
Område
Slangerup, North Zealand
Type
Warehouse
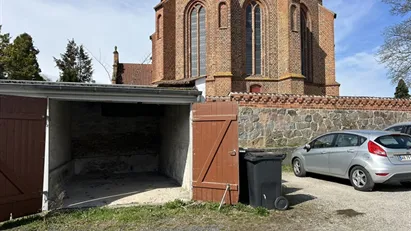
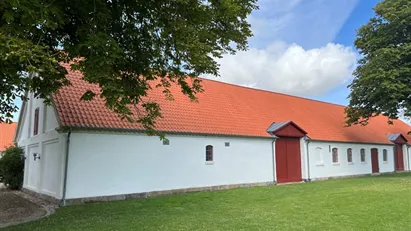
Garage in Slangerup, North Zealand
 More info
Garage in Slangerup, North Zealand
Garage for rent in Slangerup, North Zealand
Areal
15 m2
Pris pr. md.
750 DKK pr md
Område
Slangerup, North Zealand
Type
Garage
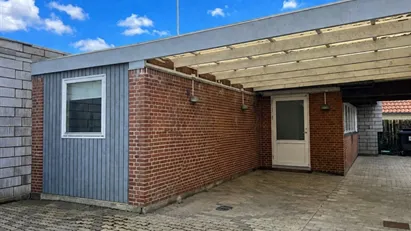
Office space in Slangerup, North Zealand
 More info
Office space in Slangerup, North Zealand
Office space for rent in Slangerup, North Zealand
Areal
69 m2
Pris pr. md.
4,000 DKK pr md
Område
Slangerup, North Zealand
Type
Office space
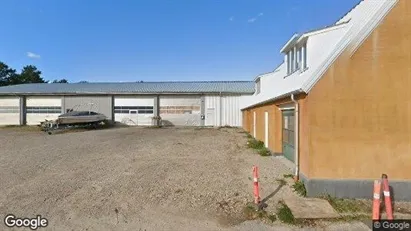
Warehouse in Slangerup, North Zealand
 More info
Warehouse in Slangerup, North Zealand
Warehouse for rent in Slangerup, North Zealand
Areal
5,000 - 15,000 m2
Pris pr. md.
781,250 DKK pr md
Område
Slangerup, North Zealand
Type
Warehouse
Warehouse in Slangerup, North Zealand
 More info
Warehouse in Slangerup, North Zealand
Warehouse for rent in Slangerup, North Zealand
Areal
550 - 3,550 m2
Pris pr. md.
Ca. 162,700 DKK pr md
Område
Slangerup, North Zealand
Type
Warehouse
Warehouse in Slangerup, North Zealand
 More info
Warehouse in Slangerup, North Zealand
Warehouse for rent in Slangerup, North Zealand
Areal
Ca. 200 m2
Pris pr. md.
Not stated
Område
Slangerup, North Zealand
Type
Warehouse
Warehouse in Slangerup, North Zealand
 More info
Warehouse in Slangerup, North Zealand
Warehouse for rent in Slangerup, North Zealand
Areal
Ca. 380 m2
Pris pr. md.
Ca. 11,850 DKK pr md
Område
Slangerup, North Zealand
Type
Warehouse
Warehouse in Slangerup, North Zealand
 More info
Warehouse in Slangerup, North Zealand
Warehouse for rent in Slangerup, North Zealand
Areal
Ca. 380 m2
Pris pr. md.
Ca. 11,850 DKK pr md
Område
Slangerup, North Zealand
Type
Warehouse
Warehouse in Slangerup, North Zealand
 More info
Warehouse in Slangerup, North Zealand
Warehouse for rent in Slangerup, North Zealand
Areal
Ca. 770 m2
Pris pr. md.
Ca. 35,300 DKK pr md
Område
Slangerup, North Zealand
Type
Warehouse
Warehouse in Slangerup, North Zealand
 More info
Warehouse in Slangerup, North Zealand
Warehouse for rent in Slangerup, North Zealand
Areal
Ca. 565 m2
Pris pr. md.
Ca. 25,900 DKK pr md
Område
Slangerup, North Zealand
Type
Warehouse
Office space in Slangerup, North Zealand
 More info
Office space in Slangerup, North Zealand
Office space for rent in Slangerup, North Zealand
Areal
Ca. 530 m2
Pris pr. md.
Ca. 24,300 DKK pr md
Område
Slangerup, North Zealand
Type
Office space
Warehouse in Slangerup, North Zealand
 More info
Warehouse in Slangerup, North Zealand
Warehouse for rent in Slangerup, North Zealand
Areal
Ca. 1,030 m2
Pris pr. md.
Ca. 47,200 DKK pr md
Område
Slangerup, North Zealand
Type
Warehouse
Warehouse in Slangerup, North Zealand
 More info
Warehouse in Slangerup, North Zealand
Warehouse for rent in Slangerup, North Zealand
Areal
Ca. 1,335 m2
Pris pr. md.
Ca. 61,200 DKK pr md
Område
Slangerup, North Zealand
Type
Warehouse
Warehouse in Slangerup, North Zealand
 More info
Warehouse in Slangerup, North Zealand
Warehouse for rent in Slangerup, North Zealand
Areal
Ca. 2,365 m2
Pris pr. md.
Ca. 108,400 DKK pr md
Område
Slangerup, North Zealand
Type
Warehouse
Office space in Slangerup, North Zealand
 More info
Office space in Slangerup, North Zealand
Office space for rent in Slangerup, North Zealand
Areal
-
Pris pr. md.
Ca. 4,000 DKK pr md
Område
Slangerup, North Zealand
Type
Office space
Garage in Slangerup, North Zealand
 More info
Garage in Slangerup, North Zealand
Garage for rent in Slangerup, North Zealand
Areal
Ca. 15 m2
Pris pr. md.
Ca. 750 DKK pr md
Område
Slangerup, North Zealand
Type
Garage
Industrial property in Slangerup, North Zealand
 More info
Industrial property in Slangerup, North Zealand
Industrial property for rent in Slangerup, North Zealand
Areal
Ca. 170 m2
Pris pr. md.
Ca. 8,800 DKK pr md
Område
Slangerup, North Zealand
Type
Industrial property
Selected customers
30,000 customers use Companyspace.com
30,000 customers
285,000 companies in our database
2,400 rentals annually
Companyspace.com is used by thousands of landlords, property companies, commercial real estate agents, investors and business centres seeking greater visibility, more enquiries and lower vacancy rates.


