Available industrial properties in Nyborg
See all available industrial properties in Nyborg below. If you are looking for industrial property in Nyborg, you have come to the right place. We have most available industrial properties in Nyborg in our database. Find industrial property in Nyborg here. Enjoy.
4 industrial properties found
-
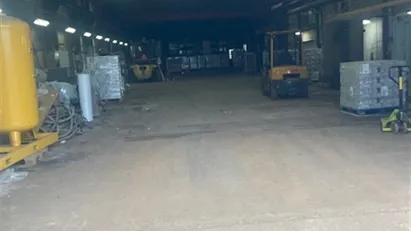
550 m2 warehouse for rent in Nyborg, Funen
- 13,000 DKK per month
- 283 DKK /m2/year
-
365 m2 office space for rent in Nyborg, Funen
- 12,333 DKK per month
- 405 DKK /m2/year
-
550 m2 warehouse for rent in Nyborg, Funen
- 13,000 DKK per month
- 283 DKK /m2/year
Statistics on the development of available industrial properties for rent in Nyborg over the past month
Also see aggregate statistics on all available industrial properties in Nyborg over time, aggregate statistics on new industrial properties in Nyborg over time, aggregate statistics on rented industrial properties in Nyborg over time
| Date | |||
|---|---|---|---|
| 13. January 2026 | 4 | 0 | 0 |
| 12. January 2026 | 4 | 0 | 0 |
| 11. January 2026 | 4 | 0 | 0 |
| 10. January 2026 | 4 | 0 | 0 |
| 9. January 2026 | 4 | 0 | 0 |
| 8. January 2026 | 4 | 0 | 0 |
| 7. January 2026 | 4 | 0 | 0 |
| 6. January 2026 | 4 | 0 | 0 |
| 5. January 2026 | 4 | 0 | 0 |
| 4. January 2026 | 4 | 0 | 0 |
| 3. January 2026 | 4 | 0 | 0 |
| 2. January 2026 | 4 | 0 | 0 |
| 1. January 2026 | 4 | 0 | 0 |
| 31. December 2025 | 4 | 0 | 0 |
| 30. December 2025 | 4 | 0 | 0 |
| 29. December 2025 | 4 | 0 | 0 |
| 28. December 2025 | 4 | 0 | 0 |
| 27. December 2025 | 4 | 0 | 0 |
| 26. December 2025 | 4 | 0 | 0 |
| 25. December 2025 | 4 | 0 | 0 |
| 24. December 2025 | 4 | 0 | 0 |
| 23. December 2025 | 4 | 0 | 0 |
| 22. December 2025 | 4 | 0 | 0 |
| 21. December 2025 | 4 | 0 | 0 |
| 20. December 2025 | 4 | 0 | 0 |
| 19. December 2025 | 4 | 0 | 0 |
| 18. December 2025 | 4 | 0 | 1 |
| 17. December 2025 | 5 | 0 | 0 |
| 16. December 2025 | 5 | 0 | 0 |
| 15. December 2025 | 5 | 0 | 0 |
| 14. December 2025 | 5 | 0 | 0 |
Statistics on currently available industrial properties in Nyborg in Denmark
Also see gathered statistics of all available industrial properties in Nyborg over time, the gathered statistics of new industrial properties in Nyborg over time, the gathered statistics of rented industrial properties in Nyborg over time
| Industrial properties | |
|---|---|
| Available premises | 4 |
| New premises since yesterday | 0 |
| Rented out premises since yesterday | 0 |
| Total available m2 | 2,196 |
| Average price per m2 per year without expenses | 43 |
| Highest price per m2 per year | 54 |
| Lowest price per m2 per year | 38 |


