


Shops in Nyborg
Companyspace.com today:
New today 291
Updated 24h 429
Notifications about new companyspaces104
Copenhagen +2
Stockholm +4
Amsterdam +16
Berlin +1
Brussels +2
Vienna +5
Paris +1
Warsaw +1
Roma (region) +2
Latest update 2 min ago
Active ads 369,221
35 shops found
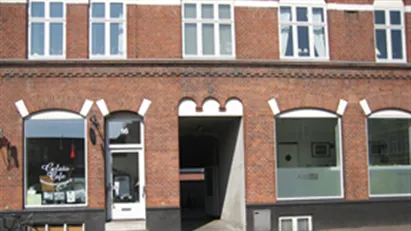
Shop in Nyborg, Funen
 More info
Shop in Nyborg, Funen
Shop for rent in Nyborg, Funen
Areal
Ca. 40 m2
Pris pr. md.
Not stated
Område
Nyborg, Funen
Type
Shop
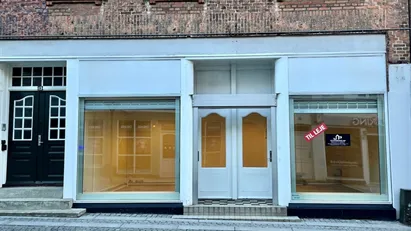
Shop in Nyborg, Funen
 More info
Shop in Nyborg, Funen
Shop for rent in Nyborg, Funen
Areal
Ca. 75 m2
Pris pr. md.
Ca. 10,550 DKK pr md
Område
Nyborg, Funen
Type
Shop
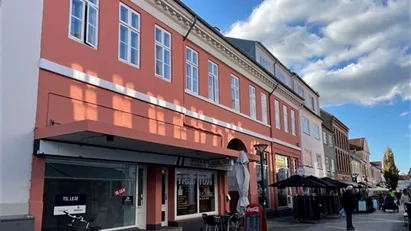
Shop in Nyborg, Funen
 More info
Shop in Nyborg, Funen
Shop for rent in Nyborg, Funen
Areal
Ca. 95 m2
Pris pr. md.
Ca. 9,550 DKK pr md
Område
Nyborg, Funen
Type
Shop
Shop in Nyborg, Funen
 More info
Shop in Nyborg, Funen
Shop for rent in Nyborg, Funen
Areal
Ca. 230 m2
Pris pr. md.
Ca. 13,650 DKK pr md
Område
Nyborg, Funen
Type
Shop
Shop in Nyborg, Funen
More info
We monitor the market!
Shop in Nyborg, Funen
Shop for rent in Nyborg, Funen
Areal
Ca. 225 m2
Pris pr. md.
Ca. 24,850 DKK pr md
Område
Nyborg, Funen
Type
Shop
Shop in Nyborg, Funen
More info
We monitor the market!
Shop in Nyborg, Funen
Shop for rent in Nyborg, Funen
Areal
Ca. 1,070 m2
Pris pr. md.
Ca. 44,600 DKK pr md
Område
Nyborg, Funen
Type
Shop
Shop in Nyborg, Funen
More info
We monitor the market!
Shop in Nyborg, Funen
Shop for rent in Nyborg, Funen
Areal
Ca. 40 m2
Pris pr. md.
Not stated
Område
Nyborg, Funen
Type
Shop
Shop in Nyborg, Funen
More info
We monitor the market!
Shop in Nyborg, Funen
Shop for rent in Nyborg, Funen
Areal
Ca. 55 m2
Pris pr. md.
Ca. 6,500 DKK pr md
Område
Nyborg, Funen
Type
Shop
Shop in Nyborg, Funen
More info
We monitor the market!
Shop in Nyborg, Funen
Shop for rent in Nyborg, Funen
Areal
Ca. 280 m2
Pris pr. md.
Ca. 10,000 DKK pr md
Område
Nyborg, Funen
Type
Shop
Shop in Nyborg, Funen
More info
We monitor the market!
Shop in Nyborg, Funen
Shop for rent in Nyborg, Funen
Areal
Ca. 105 m2
Pris pr. md.
Ca. 6,150 DKK pr md
Område
Nyborg, Funen
Type
Shop
Shop in Nyborg, Funen
More info
We monitor the market!
Shop in Nyborg, Funen
Shop for rent in Nyborg, Funen
Areal
Ca. 95 m2
Pris pr. md.
Ca. 9,550 DKK pr md
Område
Nyborg, Funen
Type
Shop
Shop in Nyborg, Funen
More info
We monitor the market!
Shop in Nyborg, Funen
Shop for rent in Nyborg, Funen
Areal
Ca. 3,015 m2
Pris pr. md.
Ca. 190,200 DKK pr md
Område
Nyborg, Funen
Type
Shop
Shop in Nyborg, Funen
More info
We monitor the market!
Shop in Nyborg, Funen
Shop for rent in Nyborg, Funen
Areal
Ca. 1,300 m2
Pris pr. md.
Ca. 83,950 DKK pr md
Område
Nyborg, Funen
Type
Shop
Shop in Nyborg, Funen
More info
We monitor the market!
Shop in Nyborg, Funen
Shop for rent in Nyborg, Funen
Areal
Ca. 715 m2
Pris pr. md.
Ca. 41,650 DKK pr md
Område
Nyborg, Funen
Type
Shop
Shop in Nyborg, Funen
More info
We monitor the market!
Shop in Nyborg, Funen
Shop for rent in Nyborg, Funen
Areal
Ca. 1,000 m2
Pris pr. md.
Ca. 64,600 DKK pr md
Område
Nyborg, Funen
Type
Shop
Shop in Nyborg, Funen
More info
We monitor the market!
Shop in Nyborg, Funen
Shop for rent in Nyborg, Funen
Areal
Ca. 605 m2
Pris pr. md.
Ca. 32,950 DKK pr md
Område
Nyborg, Funen
Type
Shop
Shop in Nyborg, Funen
More info
We monitor the market!
Shop in Nyborg, Funen
Shop for rent in Nyborg, Funen
Areal
Ca. 55 m2
Pris pr. md.
Ca. 6,500 DKK pr md
Område
Nyborg, Funen
Type
Shop
Shop in Nyborg, Funen
More info
We monitor the market!
Shop in Nyborg, Funen
Shop for rent in Nyborg, Funen
Areal
Ca. 280 m2
Pris pr. md.
Ca. 10,000 DKK pr md
Område
Nyborg, Funen
Type
Shop
Selected customers
30,000 customers use Companyspace.com
30,000 customers
285,000 companies in our database
2,400 rentals annually
Companyspace.com is used by thousands of landlords, property companies, commercial real estate agents, investors and business centres seeking greater visibility, more enquiries and lower vacancy rates.


