


Industrial properties in Glostrup
Companyspace.com today:
New today 425
Updated 24h 1,007
Notifications about new companyspaces41
Copenhagen +5
Amsterdam +1
Berlin +3
Brussels +2
Vienna +4
Dublin (county) +19
Warsaw +12
Roma (region) +1
Latest update 10 min ago
Active ads 364,406
24 industrial properties found
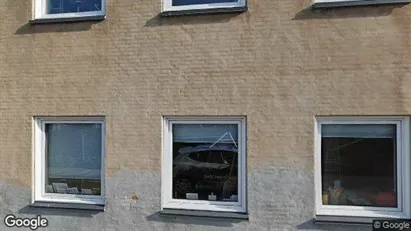
Industrial property in Glostrup, Greater Copenhagen
More info
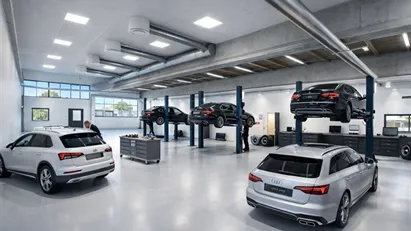

Industrial property in Glostrup, Greater Copenhagen
Industrial property for rent in Glostrup, Greater Copenhagen
Areal
543 m2
Pris pr. md.
40,182 DKK per month
Område
Glostrup, Greater Copenhagen
Type
Industrial property
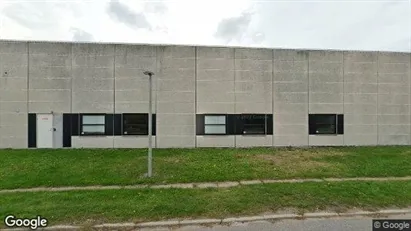
Industrial property in Glostrup, Greater Copenhagen
More info
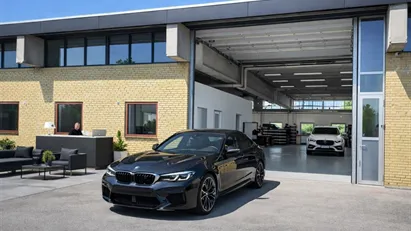
Industrial property in Glostrup, Greater Copenhagen
Industrial property for rent in Glostrup, Greater Copenhagen
Areal
362 m2
Pris pr. md.
26,788 DKK per month
Område
Glostrup, Greater Copenhagen
Type
Industrial property
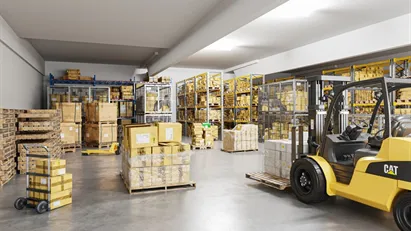
Warehouse in Glostrup, Greater Copenhagen
 More info
Warehouse in Glostrup, Greater Copenhagen
Warehouse for rent in Glostrup, Greater Copenhagen
Areal
15 - 100 m2
Pris pr. md.
5,417 DKK per month
Område
Glostrup, Greater Copenhagen
Type
Warehouse
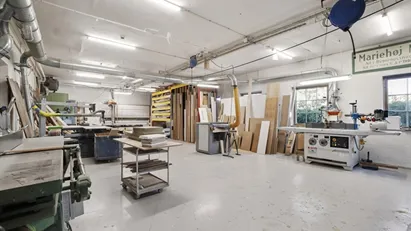
Industrial property in Glostrup, Greater Copenhagen
 More info
Industrial property in Glostrup, Greater Copenhagen
Industrial property for rent in Glostrup, Greater Copenhagen
Areal
Ca. 400 m2
Pris pr. md.
Ca. 13,000 DKK per month
Område
Glostrup, Greater Copenhagen
Type
Industrial property
Office space in Glostrup, Greater Copenhagen
 More info
Office space in Glostrup, Greater Copenhagen
Office space for rent in Glostrup, Greater Copenhagen
Areal
Ca. 575 m2
Pris pr. md.
Ca. 43,000 DKK per month
Område
Glostrup, Greater Copenhagen
Type
Office space
Warehouse in Glostrup, Greater Copenhagen
 More info
Warehouse in Glostrup, Greater Copenhagen
Warehouse for rent in Glostrup, Greater Copenhagen
Areal
Ca. 13,285 m2
Pris pr. md.
Ca. 678,100 DKK per month
Område
Glostrup, Greater Copenhagen
Type
Warehouse
Warehouse in Glostrup, Greater Copenhagen
More info
Warehouse in Glostrup, Greater Copenhagen
Warehouse for rent in Glostrup, Greater Copenhagen
Areal
Ca. 3,800 m2
Pris pr. md.
Ca. 617,500 DKK per month
Område
Glostrup, Greater Copenhagen
Type
Warehouse
Warehouse in Glostrup, Greater Copenhagen
More info
Warehouse in Glostrup, Greater Copenhagen
Warehouse for rent in Glostrup, Greater Copenhagen
Areal
Ca. 6,640 m2
Pris pr. md.
Ca. 339,050 DKK per month
Område
Glostrup, Greater Copenhagen
Type
Warehouse
Warehouse in Glostrup, Greater Copenhagen
More info
Warehouse in Glostrup, Greater Copenhagen
Warehouse for rent in Glostrup, Greater Copenhagen
Areal
Ca. 3,320 m2
Pris pr. md.
Ca. 169,500 DKK per month
Område
Glostrup, Greater Copenhagen
Type
Warehouse
Warehouse in Glostrup, Greater Copenhagen
More info
Warehouse in Glostrup, Greater Copenhagen
Warehouse for rent in Glostrup, Greater Copenhagen
Areal
Ca. 1,900 m2
Pris pr. md.
Ca. 308,750 DKK per month
Område
Glostrup, Greater Copenhagen
Type
Warehouse
Warehouse in Glostrup, Greater Copenhagen
More info
Warehouse in Glostrup, Greater Copenhagen
Warehouse for rent in Glostrup, Greater Copenhagen
Areal
Ca. 5,950 m2
Pris pr. md.
Ca. 154,400 DKK per month
Område
Glostrup, Greater Copenhagen
Type
Warehouse
Warehouse in Glostrup, Greater Copenhagen
More info
Warehouse in Glostrup, Greater Copenhagen
Warehouse for rent in Glostrup, Greater Copenhagen
Areal
Ca. 2,850 m2
Pris pr. md.
Ca. 463,150 DKK per month
Område
Glostrup, Greater Copenhagen
Type
Warehouse
Warehouse in Glostrup, Greater Copenhagen
More info
Warehouse in Glostrup, Greater Copenhagen
Warehouse for rent in Glostrup, Greater Copenhagen
Areal
Ca. 9,960 m2
Pris pr. md.
Ca. 508,550 DKK per month
Område
Glostrup, Greater Copenhagen
Type
Warehouse
Warehouse in Glostrup, Greater Copenhagen
More info
Warehouse in Glostrup, Greater Copenhagen
Warehouse for rent in Glostrup, Greater Copenhagen
Areal
Ca. 17,230 m2
Pris pr. md.
Ca. 1,368,800 DKK per month
Område
Glostrup, Greater Copenhagen
Type
Warehouse
Warehouse in Glostrup, Greater Copenhagen
 More info
Warehouse in Glostrup, Greater Copenhagen
Warehouse for rent in Glostrup, Greater Copenhagen
Areal
Ca. 1,000 m2
Pris pr. md.
Ca. 70,850 DKK per month
Område
Glostrup, Greater Copenhagen
Type
Warehouse
Warehouse in Glostrup, Greater Copenhagen
 More info
Warehouse in Glostrup, Greater Copenhagen
Warehouse for rent in Glostrup, Greater Copenhagen
Areal
Ca. 250 m2
Pris pr. md.
Ca. 17,700 DKK per month
Område
Glostrup, Greater Copenhagen
Type
Warehouse
Warehouse in Glostrup, Greater Copenhagen
 More info
Warehouse in Glostrup, Greater Copenhagen
Warehouse for rent in Glostrup, Greater Copenhagen
Areal
Ca. 500 m2
Pris pr. md.
Ca. 35,400 DKK per month
Område
Glostrup, Greater Copenhagen
Type
Warehouse
Warehouse in Glostrup, Greater Copenhagen
 More info
Warehouse in Glostrup, Greater Copenhagen
Warehouse for rent in Glostrup, Greater Copenhagen
Areal
Ca. 1,000 m2
Pris pr. md.
Ca. 70,850 DKK per month
Område
Glostrup, Greater Copenhagen
Type
Warehouse
Selected customers
Selected customers
30,000 customers use Companyspace.com
30,000 customers
285,000 companies in our database
2,400 rentals annually
Companyspace.com is used by thousands of landlords, property companies, commercial real estate agents, investors and business centres seeking greater visibility, more enquiries and lower vacancy rates.


