


Industrial propertiesin Copenhagen
See all available industrial properties in Copenhagen below. If you are looking for industrial property in Copenhagen, you have come to the right place. We have most available industrial properties in Copenhagen in our database. Find industrial property in Copenhagen here. Enjoy.
Companyspace.com today:
New today 17
Updated 24h 97
Copenhagen +2
Stockholm +1
Latest update 8 min ago
Active ads 366,015
38 industrial properties found
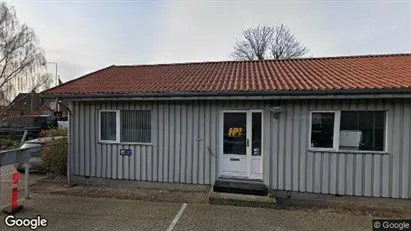
Industrial property in Dragør, Copenhagen
 More info
Industrial property in Dragør, Copenhagen
Industrial property for rent in Dragør, Copenhagen
Areal
Ca. 225 m2
Pris pr. md.
Ca. 15,000 DKK pr md
Område
Dragør, Copenhagen
Type
Industrial property
Industrial property in Dragør, Copenhagen
 More info
Industrial property in Dragør, Copenhagen
Industrial property for rent in Dragør, Copenhagen
Areal
Ca. 190 m2
Pris pr. md.
Ca. 10,700 DKK pr md
Område
Dragør, Copenhagen
Type
Industrial property
Warehouse in Kastrup, Copenhagen
 More info
Warehouse in Kastrup, Copenhagen
Warehouse for rent in Kastrup, Copenhagen
Areal
Ca. 120 m2
Pris pr. md.
Ca. 13,000 DKK pr md
Område
Kastrup, Copenhagen
Type
Warehouse
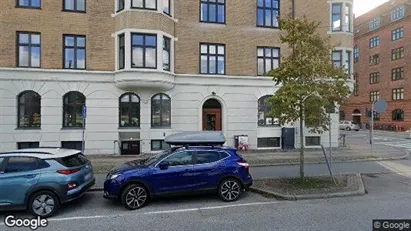
Office space in Vesterbro, Copenhagen
 More info
Office space in Vesterbro, Copenhagen
Office space for rent in Vesterbro, Copenhagen
Areal
12 - 86 m2
Pris pr. md.
Ca. 6,000 DKK pr md
Område
Vesterbro, Copenhagen
Type
Office space
Office space in Nørrebro, Copenhagen
 More info
Office space in Nørrebro, Copenhagen
Office space for rent in Nørrebro, Copenhagen
Areal
Ca. 40 m2
Pris pr. md.
Ca. 7,000 DKK pr md
Område
Nørrebro, Copenhagen
Type
Office space
Warehouse in Copenhagen SV, Copenhagen
 More info
Warehouse in Copenhagen SV, Copenhagen
Warehouse for rent in Copenhagen SV, Copenhagen
Areal
Ca. 400 m2
Pris pr. md.
Ca. 37,600 DKK pr md
Område
Copenhagen SV, Copenhagen
Type
Warehouse
Warehouse in Copenhagen S, Copenhagen
 More info
Warehouse in Copenhagen S, Copenhagen
Warehouse for rent in Copenhagen S, Copenhagen
Areal
Ca. 155 m2
Pris pr. md.
Ca. 9,700 DKK pr md
Område
Copenhagen S, Copenhagen
Type
Warehouse
Warehouse in Kastrup, Copenhagen
 More info
Warehouse in Kastrup, Copenhagen
Warehouse for rent in Kastrup, Copenhagen
Areal
Ca. 120 m2
Pris pr. md.
Ca. 13,000 DKK pr md
Område
Kastrup, Copenhagen
Type
Warehouse
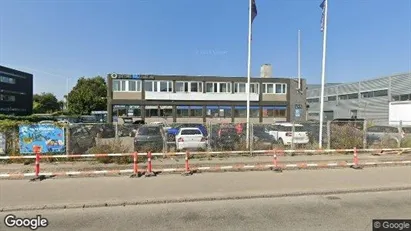
Warehouse in Copenhagen SV, Copenhagen
 More info
Warehouse in Copenhagen SV, Copenhagen
Warehouse for rent in Copenhagen SV, Copenhagen
Areal
Ca. 1,910 m2
Pris pr. md.
Ca. 142,500 DKK pr md
Område
Copenhagen SV, Copenhagen
Type
Warehouse
Warehouse in Copenhagen SV, Copenhagen
 More info
Warehouse in Copenhagen SV, Copenhagen
Warehouse for rent in Copenhagen SV, Copenhagen
Areal
Ca. 100 m2
Pris pr. md.
Ca. 11,850 DKK pr md
Område
Copenhagen SV, Copenhagen
Type
Warehouse
Office space in Copenhagen S, Copenhagen
 More info
Office space in Copenhagen S, Copenhagen
Office space for rent in Copenhagen S, Copenhagen
Areal
-
Pris pr. md.
Not stated
Område
Copenhagen S, Copenhagen
Type
Office space
Office space in Copenhagen S, Copenhagen
 More info
Office space in Copenhagen S, Copenhagen
Office space for rent in Copenhagen S, Copenhagen
Areal
-
Pris pr. md.
Not stated
Område
Copenhagen S, Copenhagen
Type
Office space
Warehouse in Copenhagen S, Copenhagen
 More info
Warehouse in Copenhagen S, Copenhagen
Warehouse for rent in Copenhagen S, Copenhagen
Areal
Ca. 195 m2
Pris pr. md.
Ca. 8,200 DKK pr md
Område
Copenhagen S, Copenhagen
Type
Warehouse
Office space in Nørrebro, Copenhagen
 More info
Office space in Nørrebro, Copenhagen
Office space for rent in Nørrebro, Copenhagen
Areal
Ca. 40 m2
Pris pr. md.
Ca. 7,000 DKK pr md
Område
Nørrebro, Copenhagen
Type
Office space
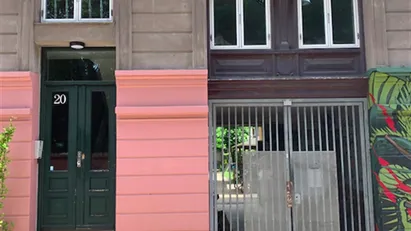
Industrial property in Copenhagen K, Copenhagen
 More info
Industrial property in Copenhagen K, Copenhagen
Industrial property for rent in Copenhagen K, Copenhagen
Areal
Ca. 45 m2
Pris pr. md.
Ca. 7,350 DKK pr md
Område
Copenhagen K, Copenhagen
Type
Industrial property
Industrial property in Frederiksberg, Copenhagen
 More info
Industrial property in Frederiksberg, Copenhagen
Industrial property for rent in Frederiksberg, Copenhagen
Areal
Ca. 20 m2
Pris pr. md.
Ca. 3,150 DKK pr md
Område
Frederiksberg, Copenhagen
Type
Industrial property
Industrial property in Frederiksberg, Copenhagen
 More info
Industrial property in Frederiksberg, Copenhagen
Industrial property for rent in Frederiksberg, Copenhagen
Areal
Ca. 20 m2
Pris pr. md.
Ca. 3,150 DKK pr md
Område
Frederiksberg, Copenhagen
Type
Industrial property
Office space in Vesterbro, Copenhagen
 More info
Office space in Vesterbro, Copenhagen
Office space for rent in Vesterbro, Copenhagen
Areal
12 - 86 m2
Pris pr. md.
Ca. 6,000 DKK pr md
Område
Vesterbro, Copenhagen
Type
Office space
Selected customers
30,000 customers use Companyspace.com
30,000 customers
285,000 companies in our database
2,400 rentals annually
Companyspace.com is used by thousands of landlords, property companies, commercial real estate agents, investors and business centres seeking greater visibility, more enquiries and lower vacancy rates.


