


Industrial property for rent, Dragør, Copenhagen, A. P. Møllers Allé 9B
A. P. Møllers Allé 9B, 2791 Dragør- Industrial property for rent
- 183 m2
- 18,300 DKK per month

- Industrial property for rent
- 183 m2
- 18,300 DKK per month
⚡ View all details about the space and get direct access to the landlord’s contact information.
Industrial property for rent, Dragør, Copenhagen, A. P. Møllers Allé 9B
Facts
Report- 3282180
- Industrial property
- Warehouse
- 183 m2
- 219,600 DKK
- 18,300 DKK
- 1,200 DKK
- 1,200 DKK
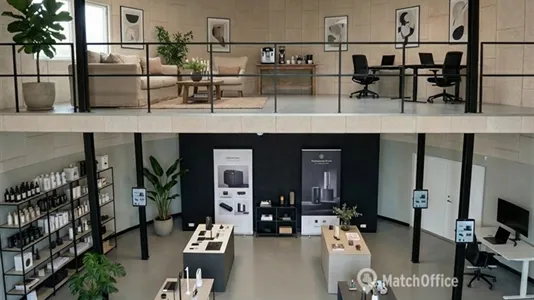
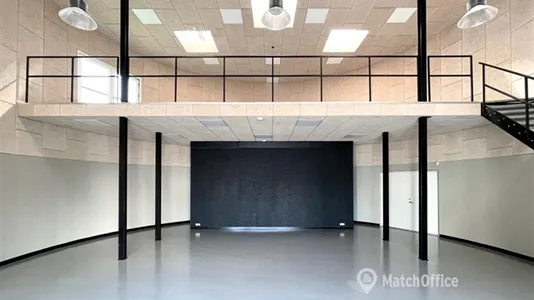
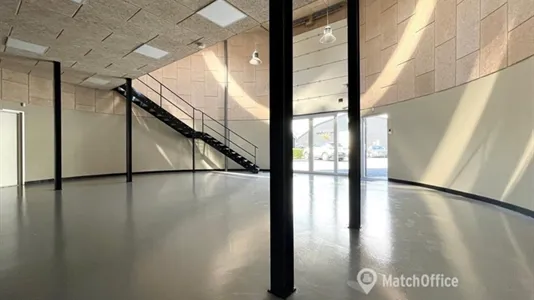
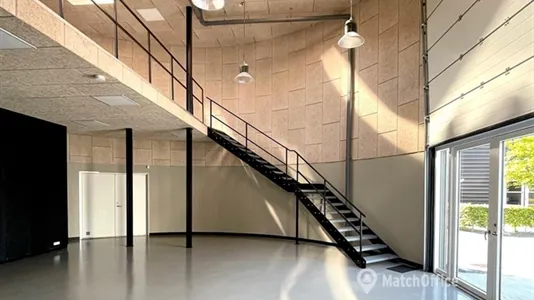
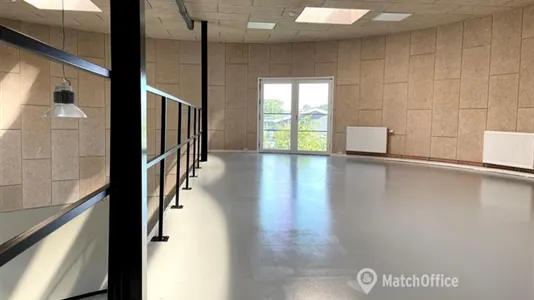
Unik ejendom - Lager/showroom/kontor - 3 meter port og dobbeltdør som kan åbnes helt op.
Der er port og indgangsparti med glas, hvilket giver nem adgang selv med større ting, ligesom der er godt og naturligt lys. 1. salen er et indskudt dæk hvilket giver mulighed for at etablere lounge,
Information and data
This industrial property for rent, that can also be used as Warehouse, is located in Dragør. Dragør is located in Copenhagen. The company space is 183 m2 in total. You can rent this industrial property for 219,600 DKK per year.
Similar search results
-
190 m2 industrial property for rent in Dragør, Copenhagen
 Free contact
- 10,687 DKK per month
- 674 DKK /m2/year
-
476 m2 office space for rent in Dragør, Copenhagen
- 38,533 DKK per month
- 971 DKK /m2/year


Frequently asked questions
Statistics on the development of available industrial properties for rent in Dragør over the past month
Below you can see the development of available industrial properties for rent in Dragør over the past month. In the first column you see the date. In the second column you see the total amount of industrial properties for rent in Dragør on the date. In the third column you see the amount of new industrial properties in Dragør that was available for rent on the date. In the fourth column you see the amount of industrial properties in Dragør that was rented on the date. Also see aggregate statistics on all available industrial properties in Dragør over time, aggregate statistics on new industrial properties in Dragør over time, aggregate statistics on rented industrial properties in Dragør over time
| Date | All industrial properties for rent | New industrial properties for rent | Rented out industrial properties |
|---|---|---|---|
| 15. January 2026 | 2 | 0 | 0 |
| 14. January 2026 | 2 | 0 | 0 |
| 13. January 2026 | 2 | 0 | 0 |
| 12. January 2026 | 2 | 0 | 0 |
| 11. January 2026 | 2 | 0 | 0 |
| 10. January 2026 | 2 | 0 | 0 |
| 9. January 2026 | 2 | 0 | 0 |
| 8. January 2026 | 2 | 0 | 0 |
| 7. January 2026 | 2 | 0 | 0 |
| 6. January 2026 | 2 | 0 | 0 |
| 5. January 2026 | 2 | 0 | 0 |
| 4. January 2026 | 2 | 0 | 0 |
| 3. January 2026 | 2 | 0 | 0 |
| 2. January 2026 | 2 | 0 | 2 |
| 1. January 2026 | 4 | 0 | 0 |
| 31. December 2025 | 4 | 0 | 0 |
| 30. December 2025 | 4 | 0 | 0 |
| 29. December 2025 | 4 | 0 | 0 |
| 28. December 2025 | 4 | 0 | 0 |
| 27. December 2025 | 4 | 0 | 1 |
| 26. December 2025 | 5 | 0 | 0 |
| 25. December 2025 | 5 | 0 | 0 |
| 24. December 2025 | 5 | 0 | 0 |
| 23. December 2025 | 5 | 0 | 0 |
| 22. December 2025 | 5 | 0 | 0 |
| 21. December 2025 | 5 | 0 | 0 |
| 20. December 2025 | 5 | 0 | 0 |
| 19. December 2025 | 5 | 0 | 0 |
| 18. December 2025 | 5 | 0 | 0 |
| 17. December 2025 | 5 | 0 | 0 |
| 16. December 2025 | 5 | 0 | 0 |
Statistics on currently available industrial properties for rent in Dragør
In the table below, you see a series of data about available industrial properties to rent in Dragør.Also see gathered statistics of all available industrial properties in Dragør over time, the gathered statistics of new industrial properties in Dragør over time, the gathered statistics of rented industrial properties in Dragør over time
| Industrial properties | |
|---|---|
| Available premises | 2 |
| New premises since yesterday | 0 |
| Rented out premises since yesterday | 0 |
| Total available m2 | 373 |
| Average price per m2 per year without expenses | 125 |
| Highest price per m2 per year | 161 |
| Lowest price per m2 per year | 90 |