


Commercial premises for rent in Spain
There are 8,283 available commercial properties in Spain right now. Companyspace.com collects commercial properties from many different parts of the market, so that you as a company can more easily get an overview of available commercial properties in Spain.
Companyspace.com today:
New today 554
Updated 24h 683
Notifications about new companyspaces1,876
Stockholm +1
Amsterdam +15
Berlin +4
Brussels +2
Vienna +11
Dublin (county) +3
Warsaw +15
Roma (region) +1
Latest update 28 min ago
Active ads 371,946
8,283 company spaces found
Restaurant in Palma de Mallorca, Islas Baleares
 More info
Restaurant in Palma de Mallorca, Islas Baleares
High-Yield Investment: Authentic Galician Gourmet Restaurant in El Arenal, Palma
Description:
Unique opportunity to acquire a top-tier establishment in one...
Areal
Ca. 290 m2
Pris pr. md.
Ca. 2,900 EUR pr md
Område
Palma de Mallorca, Islas Baleares
Type
Restaurant
Office space in Barcelona Sant Martí, Barcelona
More info
We monitor the market!
Office space in Barcelona Sant Martí, Barcelona
Exceptional 600 m² open-plan space located in the heart of Barcelona's innovation district [xxxxx]
This versatile property offers a bright and spacious la...
Areal
Ca. 650 m2
Pris pr. md.
Ca. 500 EUR pr md
Område
Barcelona Sant Martí, Barcelona
Type
Office space
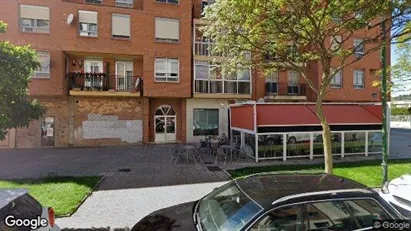
Office space in Valladolid, Castilla y León
 More info
Office space in Valladolid, Castilla y León
Office space for rent in Valladolid, Castilla y León
Areal
-
Pris pr. md.
Ca. 350 EUR pr md
Område
Valladolid, Castilla y León
Type
Office space
Office space in El Prat de Llobregat, Cataluña
 More info
Office space in El Prat de Llobregat, Cataluña
Office space for rent in El Prat de Llobregat, Cataluña
Areal
Ca. 840 m2
Pris pr. md.
Ca. 9,250 EUR pr md
Område
El Prat de Llobregat, Cataluña
Type
Office space
Office space in Terrassa, Cataluña
 More info
Office space in Terrassa, Cataluña
Office space for rent in Terrassa, Cataluña
Areal
Ca. 300 m2
Pris pr. md.
Ca. 1,200 EUR pr md
Område
Terrassa, Cataluña
Type
Office space
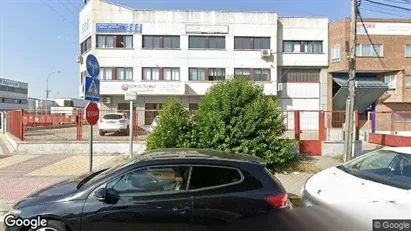
Office space in Burgos, Castilla y León
 More info
Office space in Burgos, Castilla y León
Office space for rent in Burgos, Castilla y León
Areal
Ca. 380 m2
Pris pr. md.
Not stated
Område
Burgos, Castilla y León
Type
Office space
Office space in San Sebastián de los Reyes, Comunidad de Madrid
 More info
Office space in San Sebastián de los Reyes, Comunidad de Madrid
Office space for rent in San Sebastián de los Reyes, Comunidad de Madrid
Areal
Ca. 220 m2
Pris pr. md.
Ca. 2,050 EUR pr md
Område
San Sebastián de los Reyes, Comunidad de Madrid
Type
Office space
Office space in Paterna, Comunidad Valenciana
 More info
Office space in Paterna, Comunidad Valenciana
Office space for rent in Paterna, Comunidad Valenciana
Areal
Ca. 5 m2
Pris pr. md.
Not stated
Område
Paterna, Comunidad Valenciana
Type
Office space
Commercial space in Madrid Chamberí, Madrid
 More info
Commercial space in Madrid Chamberí, Madrid
Commercial space En alquiler en Madrid Chamberí, Madrid
Areal
Ca. 40 m2
Pris pr. md.
Ca. 2,500 EUR pr md
Område
Madrid Chamberí, Madrid
Type
Commercial property
Office space in Terrassa, Cataluña
 More info
Office space in Terrassa, Cataluña
Office space for rent in Terrassa, Cataluña
Areal
Ca. 470 m2
Pris pr. md.
Ca. 3,500 EUR pr md
Område
Terrassa, Cataluña
Type
Office space
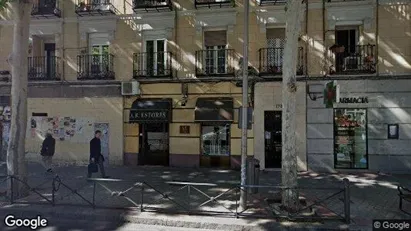
Commercial space in Madrid Retiro, Madrid
 More info
Commercial space in Madrid Retiro, Madrid
Commercial space En alquiler en Madrid Retiro, Madrid
Areal
Ca. 60 m2
Pris pr. md.
Ca. 1,900 EUR pr md
Område
Madrid Retiro, Madrid
Type
Commercial property
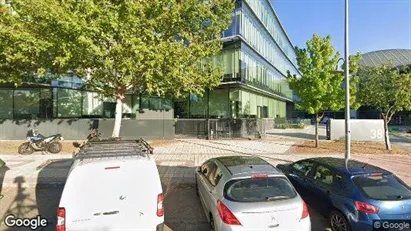
Office space in Alcobendas, Comunidad de Madrid
 More info
Office space in Alcobendas, Comunidad de Madrid
Office space for rent in Alcobendas, Comunidad de Madrid
Areal
Ca. 5 m2
Pris pr. md.
Not stated
Område
Alcobendas, Comunidad de Madrid
Type
Office space
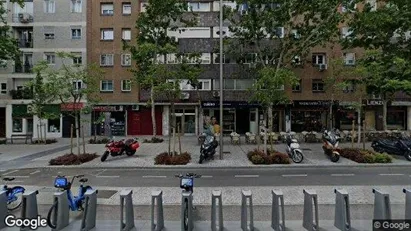
Commercial space in Madrid Tetuán, Madrid
 More info
Commercial space in Madrid Tetuán, Madrid
Commercial space for rent in Madrid Tetuán, Madrid
Areal
Ca. 105 m2
Pris pr. md.
Ca. 2,200 EUR pr md
Område
Madrid Tetuán, Madrid
Type
Commercial property
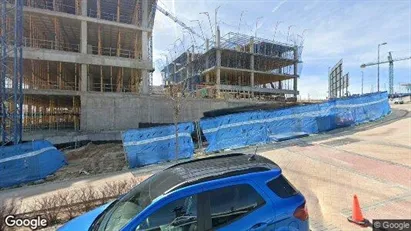
Commercial space in San Sebastián de los Reyes, Comunidad de Madrid
 More info
Commercial space in San Sebastián de los Reyes, Comunidad de Madrid
Commercial space for rent in San Sebastián de los Reyes, Comunidad de Madrid
Areal
Ca. 1,345 m2
Pris pr. md.
Ca. 10,100 EUR pr md
Område
San Sebastián de los Reyes, Comunidad de Madrid
Type
Commercial property
Office space in Tres Cantos, Comunidad de Madrid
 More info
Office space in Tres Cantos, Comunidad de Madrid
Office space for rent in Tres Cantos, Comunidad de Madrid
Areal
Ca. 920 m2
Pris pr. md.
Not stated
Område
Tres Cantos, Comunidad de Madrid
Type
Office space
Commercial space in Barcelona Eixample, Barcelona
 More info
Commercial space in Barcelona Eixample, Barcelona
Commercial space for rent in Barcelona Eixample, Barcelona
Areal
Ca. 5 m2
Pris pr. md.
Ca. 50 EUR pr md
Område
Barcelona Eixample, Barcelona
Type
Commercial property
Office space in Alcobendas, Comunidad de Madrid
 More info
Office space in Alcobendas, Comunidad de Madrid
Office space for rent in Alcobendas, Comunidad de Madrid
Areal
Ca. 345 m2
Pris pr. md.
Ca. 4,300 EUR pr md
Område
Alcobendas, Comunidad de Madrid
Type
Office space
Commercial space in Barcelona Eixample, Barcelona
 More info
Commercial space in Barcelona Eixample, Barcelona
Commercial space for rent in Barcelona Eixample, Barcelona
Areal
Ca. 35 m2
Pris pr. md.
Ca. 50 EUR pr md
Område
Barcelona Eixample, Barcelona
Type
Commercial property
Selected customers
30,000 customers use Companyspace.com
30,000 customers
285,000 companies in our database
2,400 rentals annually
Companyspace.com is used by thousands of landlords, property companies, commercial real estate agents, investors and business centres seeking greater visibility, more enquiries and lower vacancy rates.


