


Commercial premises for rent in Europe
There are 274,216 available commercial properties in Europe right now. Companyspace.com collects commercial properties from many different parts of the market, so that you as a company can more easily get an overview of available commercial properties in Europe.
Companyspace.com today:
New today 881
Updated 24h 1,447
Notifications about new companyspaces1,825
Copenhagen +3
Amsterdam +17
Berlin +14
Brussels +2
Vienna +14
Dublin (county) +44
Warsaw +45
Latest update 30 min ago
Active ads 360,316
274,216 company spaces found
Office space in Middelfart, Funen
 More info
Office space in Middelfart, Funen
Office space for rent in Middelfart, Funen
Areal
Ca. 350 m2
Pris pr. md.
Ca. 29,000 DKK pr md
Område
Middelfart, Funen
Type
Office space
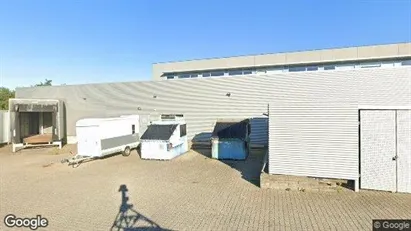
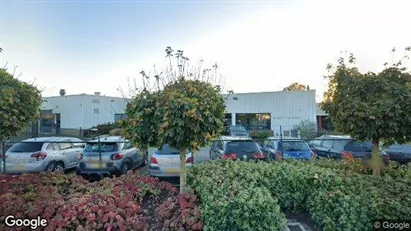
Commercial space in Nieuwegein, Province of Utrecht
 More info
Commercial space in Nieuwegein, Province of Utrecht
Commercial space for rent in Nieuwegein, Province of Utrecht
Areal
Ca. 5,400 m2
Pris pr. md.
Not stated
Område
Nieuwegein, Province of Utrecht
Type
Commercial property
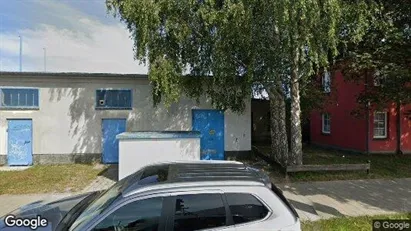
Industrial property in Vorpommern-Rügen, Mecklenburg-Vorpommern
 More info
Industrial property in Vorpommern-Rügen, Mecklenburg-Vorpommern
Industrial property for rent in Vorpommern-Rügen, Mecklenburg-Vorpommern
Areal
Ca. 520 m2
Pris pr. md.
Not stated
Område
Vorpommern-Rügen, Mecklenburg-Vorpommern
Type
Industrial property
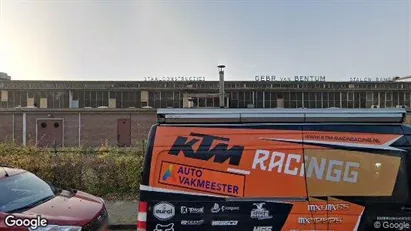
Office space in Nijmegen, Gelderland
 More info
Office space in Nijmegen, Gelderland
Office space for rent in Nijmegen, Gelderland
Areal
-
Pris pr. md.
Not stated
Område
Nijmegen, Gelderland
Type
Office space
Office space in Nordhavn, Copenhagen
 More info
Office space in Nordhavn, Copenhagen
Office space for rent in Nordhavn, Copenhagen
Areal
-
Pris pr. md.
Not stated
Område
Nordhavn, Copenhagen
Type
Office space
Industrial property in Kirkkonummi, Uusimaa
 More info
Industrial property in Kirkkonummi, Uusimaa
Industrial property for rent in Kirkkonummi, Uusimaa
Areal
Ca. 75 m2
Pris pr. md.
Ca. 800 EUR pr md
Område
Kirkkonummi, Uusimaa
Type
Industrial property
Office space in Kungsholmen, Stockholm
More info
Office space in Kungsholmen, Stockholm
Office space for rent in Kungsholmen, Stockholm
Areal
Ca. 115 m2
Pris pr. md.
Ca. 43,350 SEK pr md
Område
Kungsholmen, Stockholm
Type
Office space
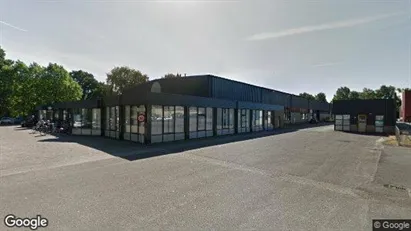
Commercial space in Weert, Limburg
 More info
Commercial space in Weert, Limburg
Commercial space for rent in Weert, Limburg
Areal
-
Pris pr. md.
Ca. 750 EUR pr md
Område
Weert, Limburg
Type
Commercial property
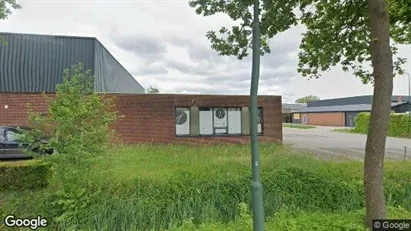
Commercial space in Meierijstad, North Brabant
 More info
Commercial space in Meierijstad, North Brabant
Commercial space for rent in Meierijstad, North Brabant
Areal
Ca. 85 m2
Pris pr. md.
Ca. 1,000 EUR pr md
Område
Meierijstad, North Brabant
Type
Commercial property
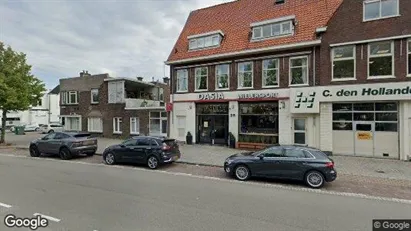
Commercial space in Haarlem, North Holland
 More info
Commercial space in Haarlem, North Holland
Commercial space for rent in Haarlem, North Holland
Areal
Ca. 490 m2
Pris pr. md.
Ca. 6,900 EUR pr md
Område
Haarlem, North Holland
Type
Commercial property
Warehouse in Haderslev, Region of Southern Denmark
 More info
Warehouse in Haderslev, Region of Southern Denmark
Warehouse for rent in Haderslev, Region of Southern Denmark
Areal
Ca. 45 m2
Pris pr. md.
Ca. 1,250 DKK pr md
Område
Haderslev, Region of Southern Denmark
Type
Warehouse
Office space in Glyfada, Attica
 More info
Office space in Glyfada, Attica
Office space for rent in Glyfada, Attica
Areal
Ca. 60 m2
Pris pr. md.
Ca. 850 EUR pr md
Område
Glyfada, Attica
Type
Office space
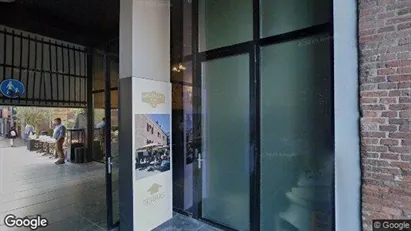
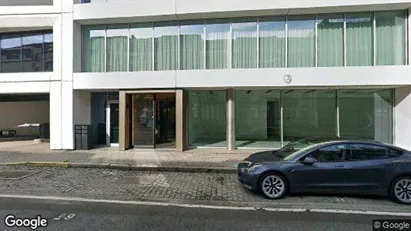
Office space in Stad Antwerp, Antwerp
 More info
Office space in Stad Antwerp, Antwerp
Office space for rent in Stad Antwerp, Antwerp
Areal
Ca. 835 m2
Pris pr. md.
Ca. 12,900 EUR pr md
Område
Stad Antwerp, Antwerp
Type
Office space
Office space in Aabenraa, Region of Southern Denmark
More info
Office space in Aabenraa, Region of Southern Denmark
Office space for rent in Aabenraa, Region of Southern Denmark
Areal
Ca. 535 m2
Pris pr. md.
Ca. 47,300 DKK pr md
Område
Aabenraa, Region of Southern Denmark
Type
Office space
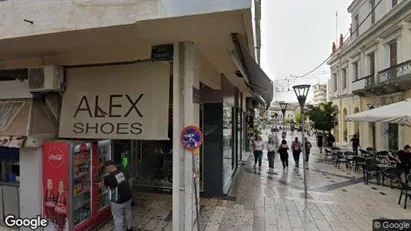
Commercial space in Patras, Western Greece
 More info
Commercial space in Patras, Western Greece
Commercial space for rent in Patras, Western Greece
Areal
Ca. 55 m2
Pris pr. md.
Ca. 600 EUR pr md
Område
Patras, Western Greece
Type
Commercial property
Office space in Haderslev, Region of Southern Denmark
More info
Office space in Haderslev, Region of Southern Denmark
Office space for rent in Haderslev, Region of Southern Denmark
Areal
Ca. 555 m2
Pris pr. md.
Ca. 23,050 DKK pr md
Område
Haderslev, Region of Southern Denmark
Type
Office space
Commercial space in Werkendam, North Brabant
 More info
Commercial space in Werkendam, North Brabant
Commercial space for rent in Werkendam, North Brabant
Areal
Ca. 365 m2
Pris pr. md.
Ca. 2,450 EUR pr md
Område
Werkendam, North Brabant
Type
Commercial property
Warehouse in Ikast, Central Jutland Region
More info
Warehouse in Ikast, Central Jutland Region
Warehouse for rent in Ikast, Central Jutland Region
Areal
120 - 300 m2
Pris pr. md.
Ca. 250 DKK pr md
Område
Ikast, Central Jutland Region
Type
Warehouse
Selected customers
30,000 customers use Companyspace.com
30,000 customers
285,000 companies in our database
2,400 rentals annually
Companyspace.com is used by thousands of landlords, property companies, commercial real estate agents, investors and business centres seeking greater visibility, more enquiries and lower vacancy rates.


