


Commercial premises for rent in Europe
There are 281,960 available commercial properties in Europe right now. Companyspace.com collects commercial properties from many different parts of the market, so that you as a company can more easily get an overview of available commercial properties in Europe.
Companyspace.com today:
New today 515
Updated 24h 1,524
Notifications about new companyspaces1,781
Copenhagen +2
Amsterdam +12
Vienna +15
Paris +5
Dublin (county) +48
Warsaw +12
Greater London +6
Latest update 33 min ago
Active ads 369,103
281,960 company spaces found
Office space in Larissa, Thessaly
 More info
Office space in Larissa, Thessaly
Office space for rent in Larissa, Thessaly
Areal
-
Pris pr. md.
Not stated
Område
Larissa, Thessaly
Type
Office space
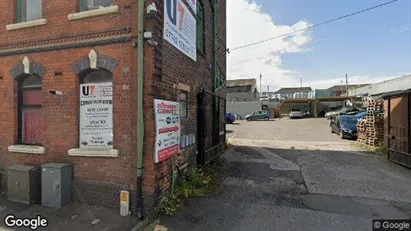
Industrial property in Stoke-on-Trent - Staffordshire, West Midlands
 More info
Industrial property in Stoke-on-Trent - Staffordshire, West Midlands
Production for rent in Stoke-on-Trent - Staffordshire, West Midlands
Areal
-
Pris pr. md.
Ca. 2,050 GBP pr md
Område
Stoke-on-Trent - Staffordshire, West Midlands
Type
Industrial property
Office space in Viby J, Aarhus
 More info
Office space in Viby J, Aarhus
Office space for rent in Viby J, Aarhus
Areal
Ca. 220 m2
Pris pr. md.
Ca. 9,150 DKK pr md
Område
Viby J, Aarhus
Type
Office space
Industrial property in Pori, Satakunta
 More info
Industrial property in Pori, Satakunta
Industrial property for rent in Pori, Satakunta
Areal
Ca. 100 m2
Pris pr. md.
Ca. 500 EUR pr md
Område
Pori, Satakunta
Type
Industrial property
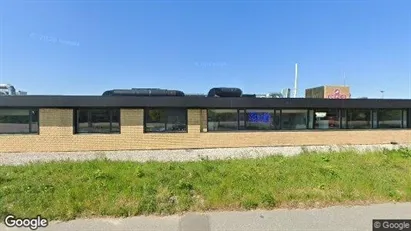
Commercial space in Oulu, Pohjois-Pohjanmaa
 More info
Commercial space in Oulu, Pohjois-Pohjanmaa
Commercial space for rent in Oulu, Pohjois-Pohjanmaa
Areal
Ca. 150 m2
Pris pr. md.
Ca. 1,800 EUR pr md
Område
Oulu, Pohjois-Pohjanmaa
Type
Commercial property
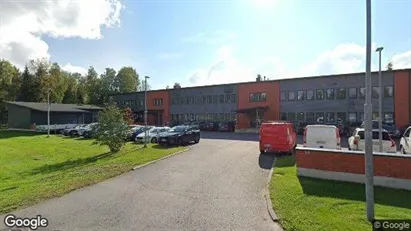
Industrial property in Kouvola, Kymenlaakso
 More info
Industrial property in Kouvola, Kymenlaakso
Industrial property for rent in Kouvola, Kymenlaakso
Areal
50 - 354 m2
Pris pr. md.
Ca. 2,100 EUR pr md
Område
Kouvola, Kymenlaakso
Type
Industrial property
Commercial space in Frankfurt Innenstadt II, Frankfurt (region)
 More info
Commercial space in Frankfurt Innenstadt II, Frankfurt (region)
Commercial space for rent in Frankfurt Innenstadt II, Frankfurt (region)
Areal
343 - 2,108 m2
Pris pr. md.
Not stated
Område
Frankfurt Innenstadt II, Frankfurt (region)
Type
Commercial property
Commercial space in Blankenberge, West-Vlaanderen
 More info
Commercial space in Blankenberge, West-Vlaanderen
Commercial space for rent in Blankenberge, West-Vlaanderen
Areal
-
Pris pr. md.
Ca. 2,850 EUR pr md
Område
Blankenberge, West-Vlaanderen
Type
Commercial property
Commercial space in Falun, Dalarna
 More info
Commercial space in Falun, Dalarna
Commercial space for rent in Falun, Dalarna
Areal
Ca. 15 m2
Pris pr. md.
Ca. 800 SEK pr md
Område
Falun, Dalarna
Type
Commercial property
Office space in Hamburg Mitte, Hamburg
 More info
Office space in Hamburg Mitte, Hamburg
Office space for rent in Hamburg Mitte, Hamburg
Areal
Ca. 240 m2
Pris pr. md.
Not stated
Område
Hamburg Mitte, Hamburg
Type
Office space
Office space in Gadstrup, Region Zealand
 More info
Office space in Gadstrup, Region Zealand
Office space for rent in Gadstrup, Region Zealand
Areal
Ca. 315 m2
Pris pr. md.
Ca. 18,300 DKK pr md
Område
Gadstrup, Region Zealand
Type
Office space
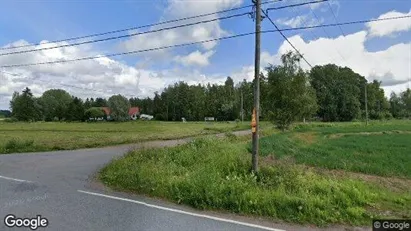
Commercial space in Nurmijärvi, Uusimaa
 More info
Commercial space in Nurmijärvi, Uusimaa
Commercial space for rent in Nurmijärvi, Uusimaa
Areal
Ca. 95 m2
Pris pr. md.
Not stated
Område
Nurmijärvi, Uusimaa
Type
Commercial property
Office space in Vojens, Region of Southern Denmark
More info
Office space in Vojens, Region of Southern Denmark
Office space for rent in Vojens, Region of Southern Denmark
Areal
Ca. 550 m2
Pris pr. md.
Ca. 29,450 DKK pr md
Område
Vojens, Region of Southern Denmark
Type
Office space
Commercial space in Falun, Dalarna
 More info
Commercial space in Falun, Dalarna
Commercial space for rent in Falun, Dalarna
Areal
Ca. 15 m2
Pris pr. md.
Ca. 1,000 SEK pr md
Område
Falun, Dalarna
Type
Commercial property
Office space in Östermalm, Stockholm
More info
Office space in Östermalm, Stockholm
Office space for rent in Östermalm, Stockholm
Areal
Ca. 85 m2
Pris pr. md.
Ca. 30,750 SEK pr md
Område
Östermalm, Stockholm
Type
Office space
Office space in Mikkeli, Etelä-Savo
 More info
Office space in Mikkeli, Etelä-Savo
Office space for rent in Mikkeli, Etelä-Savo
Areal
-
Pris pr. md.
Not stated
Område
Mikkeli, Etelä-Savo
Type
Office space
Office space in Katowice, Śląskie
 More info
Office space in Katowice, Śląskie
Office space for rent in Katowice, Śląskie
Areal
Ca. 250 m2
Pris pr. md.
Ca. 11,500 PLN pr md
Område
Katowice, Śląskie
Type
Office space
Commercial space in Haarlem, North Holland
 More info
Commercial space in Haarlem, North Holland
Commercial space for rent in Haarlem, North Holland
Areal
Ca. 20 m2
Pris pr. md.
Ca. 350 EUR pr md
Område
Haarlem, North Holland
Type
Commercial property
Selected customers
30,000 customers use Companyspace.com
30,000 customers
285,000 companies in our database
2,400 rentals annually
Companyspace.com is used by thousands of landlords, property companies, commercial real estate agents, investors and business centres seeking greater visibility, more enquiries and lower vacancy rates.


