


Commercial premises for rent in Europe
There are 281,922 available commercial properties in Europe right now. Companyspace.com collects commercial properties from many different parts of the market, so that you as a company can more easily get an overview of available commercial properties in Europe.
Companyspace.com today:
New today 477
Updated 24h 1,507
Notifications about new companyspaces44
Copenhagen +2
Amsterdam +12
Vienna +1
Paris +5
Dublin (county) +48
Warsaw +12
Greater London +6
Latest update 15 min ago
Active ads 369,076
281,922 company spaces found
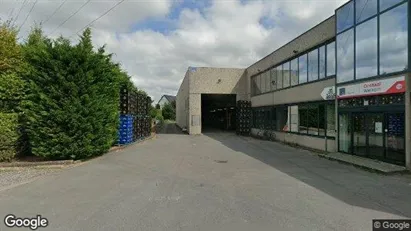
Commercial space in Lendelede, West-Vlaanderen
 More info
Commercial space in Lendelede, West-Vlaanderen
Commercial space for rent in Lendelede, West-Vlaanderen
Areal
Ca. 2,065 m2
Pris pr. md.
Ca. 750 EUR pr md
Område
Lendelede, West-Vlaanderen
Type
Commercial property
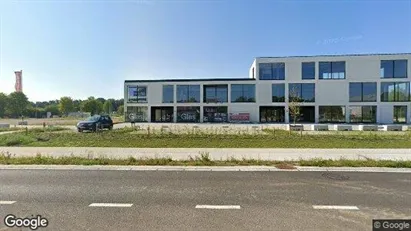
Commercial space in Hasselt, Limburg
 More info
Commercial space in Hasselt, Limburg
Commercial space for rent in Hasselt, Limburg
Areal
-
Pris pr. md.
Ca. 1,950 EUR pr md
Område
Hasselt, Limburg
Type
Commercial property
Office space in Tallinn Kesklinna, Tallinn
 More info
Office space in Tallinn Kesklinna, Tallinn
Office space for rent in Tallinn Kesklinna, Tallinn
Areal
Ca. 170 m2
Pris pr. md.
Ca. 2,350 EUR pr md
Område
Tallinn Kesklinna, Tallinn
Type
Office space
Warehouse in Kolding, Region of Southern Denmark
 More info
Warehouse in Kolding, Region of Southern Denmark
Warehouse for rent in Kolding, Region of Southern Denmark
Areal
Ca. 1,565 m2
Pris pr. md.
Ca. 58,650 DKK pr md
Område
Kolding, Region of Southern Denmark
Type
Warehouse
Office space in Copenhagen K, Copenhagen
 More info
Office space in Copenhagen K, Copenhagen
Office space for rent in Copenhagen K, Copenhagen
Areal
Ca. 1,275 m2
Pris pr. md.
Ca. 224,800 DKK pr md
Område
Copenhagen K, Copenhagen
Type
Office space
Industrial property in Haderslev, Region of Southern Denmark
 More info
Industrial property in Haderslev, Region of Southern Denmark
Industrial property for rent in Haderslev, Region of Southern Denmark
Areal
Ca. 4,045 m2
Pris pr. md.
Ca. 111,000 DKK pr md
Område
Haderslev, Region of Southern Denmark
Type
Industrial property
Office space in Tallinn Kesklinna, Tallinn
 More info
Office space in Tallinn Kesklinna, Tallinn
Office space for rent in Tallinn Kesklinna, Tallinn
Areal
Ca. 435 m2
Pris pr. md.
Ca. 6,150 EUR pr md
Område
Tallinn Kesklinna, Tallinn
Type
Office space
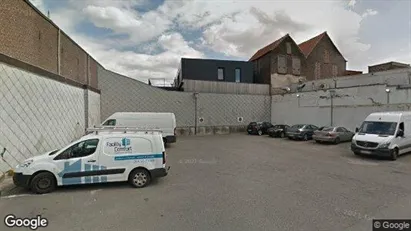
Office space in Kortrijk, West-Vlaanderen
 More info
Office space in Kortrijk, West-Vlaanderen
Office space for rent in Kortrijk, West-Vlaanderen
Areal
Ca. 2,065 m2
Pris pr. md.
Ca. 6,450 EUR pr md
Område
Kortrijk, West-Vlaanderen
Type
Office space
Office space in Thisted, North Jutland Region
 More info
Office space in Thisted, North Jutland Region
Office space for rent in Thisted, North Jutland Region
Areal
Ca. 440 m2
Pris pr. md.
Ca. 23,800 DKK pr md
Område
Thisted, North Jutland Region
Type
Office space
Commercial space in Rae, Harju
 More info
Commercial space in Rae, Harju
Commercial space for rent in Rae, Harju
Areal
Ca. 545 m2
Pris pr. md.
Ca. 3,400 EUR pr md
Område
Rae, Harju
Type
Commercial property
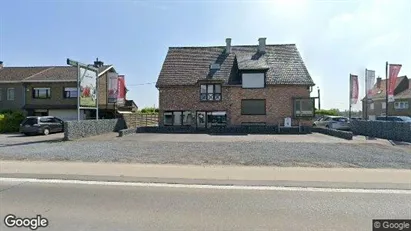
Office space in Waregem, West-Vlaanderen
 More info
Office space in Waregem, West-Vlaanderen
Office space for rent in Waregem, West-Vlaanderen
Areal
Ca. 255 m2
Pris pr. md.
Ca. 1,900 EUR pr md
Område
Waregem, West-Vlaanderen
Type
Office space
Office space in Waregem, West-Vlaanderen
 More info
Office space in Waregem, West-Vlaanderen
Office space for rent in Waregem, West-Vlaanderen
Areal
Ca. 2,065 m2
Pris pr. md.
Ca. 1,300 EUR pr md
Område
Waregem, West-Vlaanderen
Type
Office space
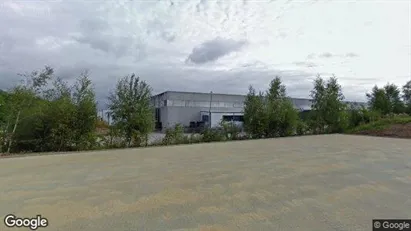
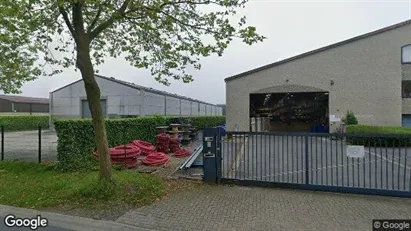
Warehouse in Jabbeke, West-Vlaanderen
 More info
Warehouse in Jabbeke, West-Vlaanderen
Warehouse for rent in Jabbeke, West-Vlaanderen
Areal
Ca. 1,015 m2
Pris pr. md.
Ca. 1,450 EUR pr md
Område
Jabbeke, West-Vlaanderen
Type
Warehouse
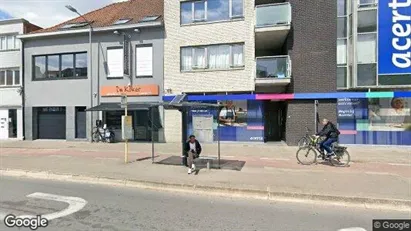
Office space in Vilvoorde, Vlaams-Brabant
 More info
Office space in Vilvoorde, Vlaams-Brabant
Office space for rent in Vilvoorde, Vlaams-Brabant
Areal
Ca. 2,065 m2
Pris pr. md.
Ca. 2,450 EUR pr md
Område
Vilvoorde, Vlaams-Brabant
Type
Office space
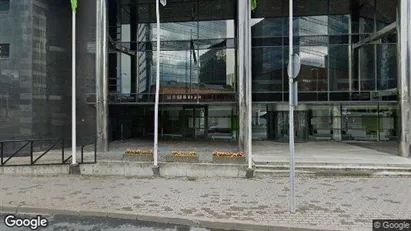
Office space in Stad Gent, Gent
 More info
Office space in Stad Gent, Gent
Office space for rent in Stad Gent, Gent
Areal
-
Pris pr. md.
Ca. 8,200 EUR pr md
Område
Stad Gent, Gent
Type
Office space
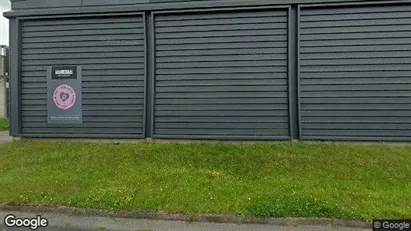
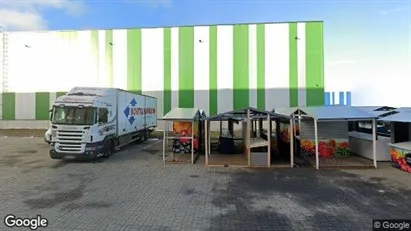
Warehouse in Anzegem, West-Vlaanderen
 More info
Warehouse in Anzegem, West-Vlaanderen
Warehouse for rent in Anzegem, West-Vlaanderen
Areal
Ca. 75 m2
Pris pr. md.
Ca. 1,300 EUR pr md
Område
Anzegem, West-Vlaanderen
Type
Warehouse
Office space in Copenhagen K, Copenhagen
More info
Office space in Copenhagen K, Copenhagen
Office space for rent in Copenhagen K, Copenhagen
Areal
Ca. 4,190 m2
Pris pr. md.
Ca. 864,400 DKK pr md
Område
Copenhagen K, Copenhagen
Type
Office space
Warehouse in Schoten, Antwerp (Province)
 More info
Warehouse in Schoten, Antwerp (Province)
Warehouse for rent in Schoten, Antwerp (Province)
Areal
Ca. 2,065 m2
Pris pr. md.
Ca. 19,000 EUR pr md
Område
Schoten, Antwerp (Province)
Type
Warehouse
Selected customers
30,000 customers use Companyspace.com
30,000 customers
285,000 companies in our database
2,400 rentals annually
Companyspace.com is used by thousands of landlords, property companies, commercial real estate agents, investors and business centres seeking greater visibility, more enquiries and lower vacancy rates.


