


Commercial premises for rent in Europe
There are 281,960 available commercial properties in Europe right now. Companyspace.com collects commercial properties from many different parts of the market, so that you as a company can more easily get an overview of available commercial properties in Europe.
Companyspace.com today:
New today 515
Updated 24h 1,524
Notifications about new companyspaces1,781
Copenhagen +2
Amsterdam +12
Vienna +15
Paris +5
Dublin (county) +48
Warsaw +12
Greater London +6
Latest update 57 min ago
Active ads 369,103
281,960 company spaces found
Warehouse in Odense SØ, Odense
 More info
Warehouse in Odense SØ, Odense
Warehouse for rent in Odense SØ, Odense
Areal
Ca. 470 m2
Pris pr. md.
Ca. 20,200 DKK pr md
Område
Odense SØ, Odense
Type
Warehouse
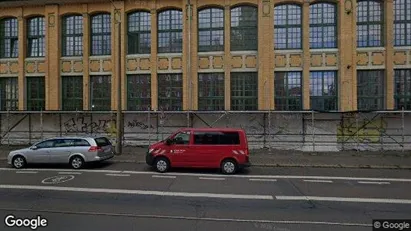
Office space in Leipzig, Sachsen
 More info
Office space in Leipzig, Sachsen
Office space for rent in Leipzig, Sachsen
Areal
Ca. 1,155 m2
Pris pr. md.
Not stated
Område
Leipzig, Sachsen
Type
Office space
Office space in Virum, Greater Copenhagen
 More info
Office space in Virum, Greater Copenhagen
Office space for rent in Virum, Greater Copenhagen
Areal
Ca. 25 m2
Pris pr. md.
Ca. 3,200 DKK pr md
Område
Virum, Greater Copenhagen
Type
Office space
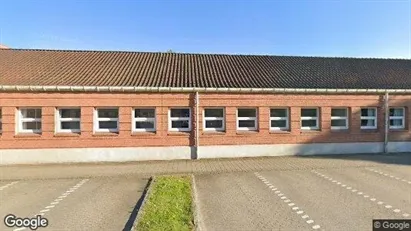
Office space in Næstved, Region Zealand
 More info
Office space in Næstved, Region Zealand
Office space for rent in Næstved, Region Zealand
Areal
Ca. 3,015 m2
Pris pr. md.
Ca. 255,700 DKK pr md
Område
Næstved, Region Zealand
Type
Office space
Office space in Ede, Gelderland
 More info
Office space in Ede, Gelderland
Office space for rent in Ede, Gelderland
Areal
Ca. 250 m2
Pris pr. md.
Not stated
Område
Ede, Gelderland
Type
Office space
Office space in Ludwigslust-Parchim, Mecklenburg-Vorpommern
 More info
Office space in Ludwigslust-Parchim, Mecklenburg-Vorpommern
Office space for rent in Ludwigslust-Parchim, Mecklenburg-Vorpommern
Areal
Ca. 15 m2
Pris pr. md.
Ca. 50 EUR pr md
Område
Ludwigslust-Parchim, Mecklenburg-Vorpommern
Type
Office space
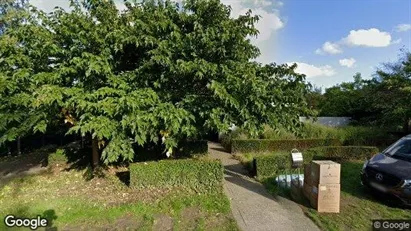
Warehouse in Gavere, Oost-Vlaanderen
 More info
Warehouse in Gavere, Oost-Vlaanderen
Warehouse for rent in Gavere, Oost-Vlaanderen
Areal
Ca. 1,875 m2
Pris pr. md.
Ca. 8,350 EUR pr md
Område
Gavere, Oost-Vlaanderen
Type
Warehouse
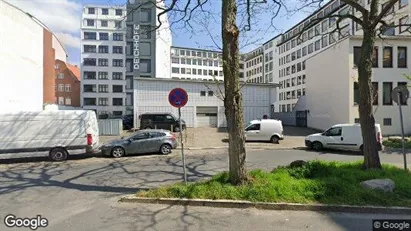
Office space in Hamburg Mitte, Hamburg
 More info
Office space in Hamburg Mitte, Hamburg
Office space for rent in Hamburg Mitte, Hamburg
Areal
Ca. 395 m2
Pris pr. md.
Not stated
Område
Hamburg Mitte, Hamburg
Type
Office space
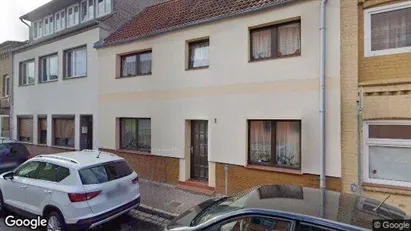
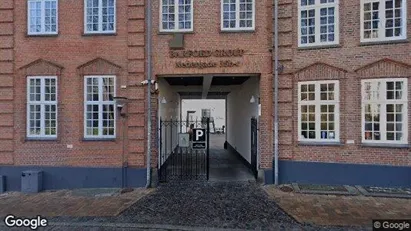
Office space in Odense C, Odense
 More info
Office space in Odense C, Odense
Office space for rent in Odense C, Odense
Areal
Ca. 330 m2
Pris pr. md.
Ca. 21,750 DKK pr md
Område
Odense C, Odense
Type
Office space
Office space in The Hague Centrum, The Hague
 More info
Office space in The Hague Centrum, The Hague
Kantoor te huur in Den Haag Centrum, Den Haag
Areal
-
Pris pr. md.
Ca. 3,750 EUR pr md
Område
The Hague Centrum, The Hague
Type
Office space
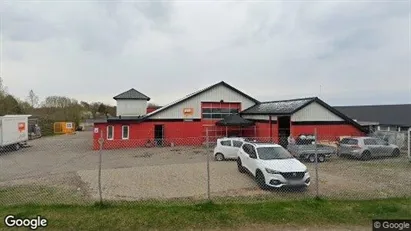
Warehouse in Kalundborg, Region Zealand
 More info
Warehouse in Kalundborg, Region Zealand
Warehouse for rent in Kalundborg, Region Zealand
Areal
Ca. 455 m2
Pris pr. md.
Ca. 18,800 DKK pr md
Område
Kalundborg, Region Zealand
Type
Warehouse
Office space in Hamburg Altona, Hamburg
 More info
Office space in Hamburg Altona, Hamburg
Office space for rent in Hamburg Altona, Hamburg
Areal
Ca. 120 m2
Pris pr. md.
Ca. 100 EUR pr md
Område
Hamburg Altona, Hamburg
Type
Office space
Office space in Aalborg SØ, Aalborg (region)
 More info
Office space in Aalborg SØ, Aalborg (region)
Office space for rent in Aalborg SØ, Aalborg (region)
Areal
Ca. 425 m2
Pris pr. md.
Ca. 29,850 DKK pr md
Område
Aalborg SØ, Aalborg (region)
Type
Office space
Office space in Ilioupoli, Attica
 More info
Office space in Ilioupoli, Attica
Office space for rent in Ilioupoli, Attica
Areal
Ca. 35 m2
Pris pr. md.
Ca. 450 EUR pr md
Område
Ilioupoli, Attica
Type
Office space
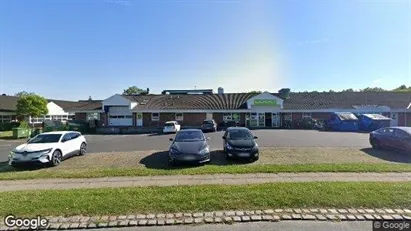
Commercial space in Svendborg, Funen
 More info
Commercial space in Svendborg, Funen
Commercial space for rent in Svendborg, Funen
Areal
Ca. 1,050 m2
Pris pr. md.
Ca. 29,000 DKK pr md
Område
Svendborg, Funen
Type
Commercial property
Office space in Nuremberg, Bayern
 More info
Office space in Nuremberg, Bayern
Office space for rent in Nuremberg, Bayern
Areal
Ca. 50 m2
Pris pr. md.
Ca. 379,000 EUR pr md
Område
Nuremberg, Bayern
Type
Office space
Office space in Taastrup, Greater Copenhagen
 More info
Office space in Taastrup, Greater Copenhagen
Office space for rent in Taastrup, Greater Copenhagen
Areal
Ca. 440 m2
Pris pr. md.
Ca. 18,350 DKK pr md
Område
Taastrup, Greater Copenhagen
Type
Office space
Office space in Piraeus, Attica
 More info
Office space in Piraeus, Attica
Office space for rent in Piraeus, Attica
Areal
-
Pris pr. md.
Not stated
Område
Piraeus, Attica
Type
Office space
Selected customers
30,000 customers use Companyspace.com
30,000 customers
285,000 companies in our database
2,400 rentals annually
Companyspace.com is used by thousands of landlords, property companies, commercial real estate agents, investors and business centres seeking greater visibility, more enquiries and lower vacancy rates.


