


Office space for rent in Zuienkerke
These commercial premises are closest to your search
We currently have no available commercial premises registered that match your search exactly. Therefore, we show below the commercial premises that best match your search based on the current market.
The shown listings may differ from your original search in terms of, for example, premises type, location, size or price, but they have been selected because they may be relevant alternatives for your business.
Take a look at the suggestions below – or start your search again here.
Companyspace.com today:
New today 521
Updated 24h 1,625
Notifications about new companyspaces1,573
Copenhagen +2
Stockholm +2
Amsterdam +19
Brussels +2
Vienna +7
Paris +6
Madrid +1
Dublin (county) +2
Warsaw +1
Greater London +17
Latest update 4 min ago
Active ads 369,918
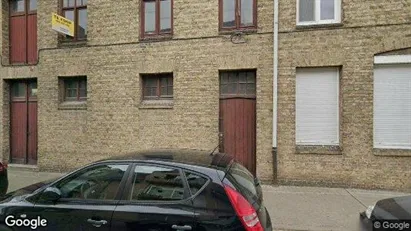
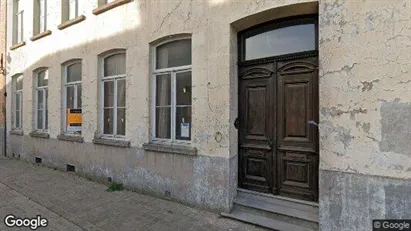
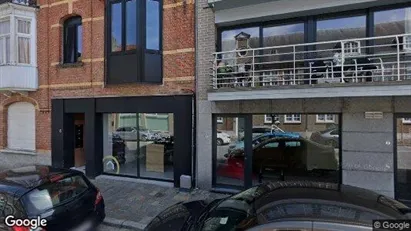
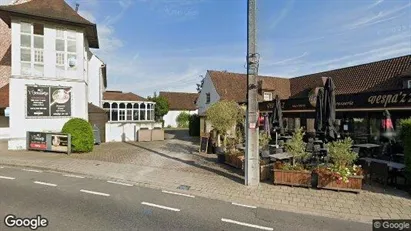
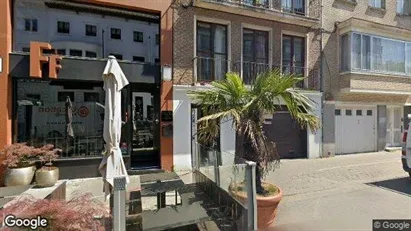
Commercial space in Koksijde, West-Vlaanderen
 More info
Commercial space in Koksijde, West-Vlaanderen
Ideally located in the heart of Koksijde-Bad's main shopping street, bean at the town hall, the commercial property is divided as follows:
Basement: large d...
Areal
Ca. 205 m2
Pris pr. md.
Ca. 2,450 EUR pr md
Område
Koksijde, West-Vlaanderen
Type
Commercial property
Warehouse property in Diksmuide, West-Vlaanderen
 More info
Warehouse property in Diksmuide, West-Vlaanderen
Warehouse for sale in Diksmuide, West-Vlaanderen
Areal
Ca. 165 m2
Pris
Ca. 150,000EUR
Område
Diksmuide, West-Vlaanderen
Type
Warehouse
Commercial property in Diksmuide, West-Vlaanderen
 More info
Commercial property in Diksmuide, West-Vlaanderen
Commercial property for sale in Diksmuide, West-Vlaanderen
Areal
Ca. 95 m2
Pris
Ca. 195,000EUR
Område
Diksmuide, West-Vlaanderen
Type
Commercial property
Commercial space in Roeselare, West-Vlaanderen
 More info
Commercial space in Roeselare, West-Vlaanderen
Commercial space for rent in Roeselare, West-Vlaanderen
Areal
Ca. 850 m2
Pris pr. md.
Ca. 11,650 EUR pr md
Område
Roeselare, West-Vlaanderen
Type
Commercial property
Office property in Zwevegem, West-Vlaanderen
 More info
Office property in Zwevegem, West-Vlaanderen
Office space for sale in Zwevegem, West-Vlaanderen
Areal
Ca. 720 m2
Pris
Ca. 1,618,000EUR
Område
Zwevegem, West-Vlaanderen
Type
Office space
Commercial property in Brugge, West-Vlaanderen
 More info
Commercial property in Brugge, West-Vlaanderen
Commercial property for sale in Brugge, West-Vlaanderen
Areal
Ca. 740 m2
Pris
Ca. 1,090,000EUR
Område
Brugge, West-Vlaanderen
Type
Commercial property
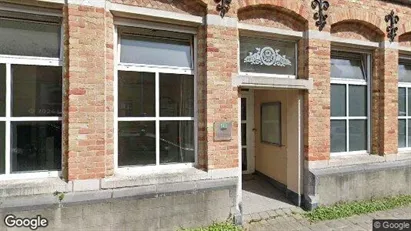
Commercial property in Ieper, West-Vlaanderen
 More info
Commercial property in Ieper, West-Vlaanderen
Commercial property for sale in Ieper, West-Vlaanderen
Areal
Ca. 120 m2
Pris
Ca. 325,000EUR
Område
Ieper, West-Vlaanderen
Type
Commercial property
Commercial property in Pittem, West-Vlaanderen
 More info
Commercial property in Pittem, West-Vlaanderen
Commercial property for sale in Pittem, West-Vlaanderen
Areal
Ca. 2,380 m2
Pris
Ca. 795,000EUR
Område
Pittem, West-Vlaanderen
Type
Commercial property
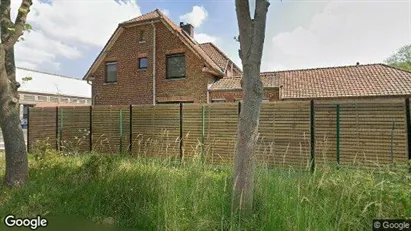
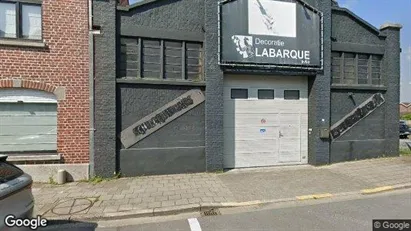
Warehouse property in Zonnebeke, West-Vlaanderen
 More info
Warehouse property in Zonnebeke, West-Vlaanderen
Warehouse for sale in Zonnebeke, West-Vlaanderen
Areal
Ca. 130 m2
Pris
Ca. 40,000EUR
Område
Zonnebeke, West-Vlaanderen
Type
Warehouse
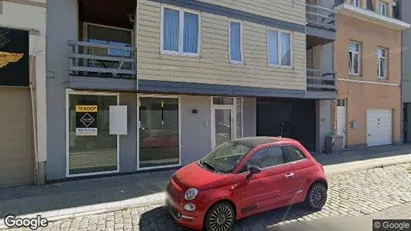
Office property in Nieuwpoort, West-Vlaanderen
 More info
Office property in Nieuwpoort, West-Vlaanderen
Office space for sale in Nieuwpoort, West-Vlaanderen
Areal
Ca. 70 m2
Pris
Ca. 145,000EUR
Område
Nieuwpoort, West-Vlaanderen
Type
Office space
Commercial property in Blankenberge, West-Vlaanderen
 More info
Commercial property in Blankenberge, West-Vlaanderen
Commercial property for sale in Blankenberge, West-Vlaanderen
Areal
-
Pris
Ca. 249,000EUR
Område
Blankenberge, West-Vlaanderen
Type
Commercial property
Warehouse property in Zwevegem, West-Vlaanderen
 More info
Warehouse property in Zwevegem, West-Vlaanderen
Warehouse for sale in Zwevegem, West-Vlaanderen
Areal
Ca. 265 m2
Pris
Ca. 215,000EUR
Område
Zwevegem, West-Vlaanderen
Type
Warehouse
Commercial property in Ieper, West-Vlaanderen
 More info
Commercial property in Ieper, West-Vlaanderen
Commercial property for sale in Ieper, West-Vlaanderen
Areal
Ca. 440 m2
Pris
Ca. 249,000EUR
Område
Ieper, West-Vlaanderen
Type
Commercial property
Commercial property in Roeselare, West-Vlaanderen
 More info
Commercial property in Roeselare, West-Vlaanderen
Commercial property for sale in Roeselare, West-Vlaanderen
Areal
Ca. 565 m2
Pris
Ca. 999,000EUR
Område
Roeselare, West-Vlaanderen
Type
Commercial property
Office property in Oostende, West-Vlaanderen
 More info
Office property in Oostende, West-Vlaanderen
Office space for sale in Oostende, West-Vlaanderen
Areal
-
Pris
Ca. 180,000EUR
Område
Oostende, West-Vlaanderen
Type
Office space
Commercial property in Waregem, West-Vlaanderen
 More info
Commercial property in Waregem, West-Vlaanderen
Commercial property for sale in Waregem, West-Vlaanderen
Areal
Ca. 125 m2
Pris
Ca. 450,000EUR
Område
Waregem, West-Vlaanderen
Type
Commercial property
Commercial property in Roeselare, West-Vlaanderen
 More info
Commercial property in Roeselare, West-Vlaanderen
Commercial property for sale in Roeselare, West-Vlaanderen
Areal
Ca. 4,160 m2
Pris
Ca. 2,835,000EUR
Område
Roeselare, West-Vlaanderen
Type
Commercial property
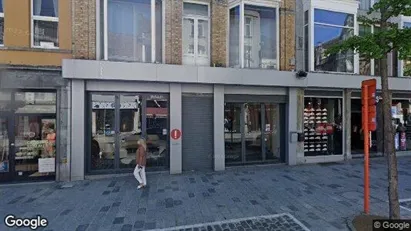
Commercial property in Kortrijk, West-Vlaanderen
 More info
Commercial property in Kortrijk, West-Vlaanderen
Commercial property for sale in Kortrijk, West-Vlaanderen
Areal
Ca. 100 m2
Pris
Ca. 1,257,000EUR
Område
Kortrijk, West-Vlaanderen
Type
Commercial property
Selected customers
30,000 customers use Companyspace.com
30,000 customers
285,000 companies in our database
2,400 rentals annually
Companyspace.com is used by thousands of landlords, property companies, commercial real estate agents, investors and business centres seeking greater visibility, more enquiries and lower vacancy rates.


