


Office space for rentin Gent
See all office locations for rent, office spaces for rent, office rentals and offices for rent in Gent below. If you are looking for an office location for rent, office rental, office space for rentor office for rent in Gent, you have come to the right place. We have most office spaces for rent and for leasein Gent in our database. Find your new office space for rentin Gent here. Enjoy.
Companyspace.com today:
New today 181
Updated 24h 406
Notifications about new companyspaces2,048
Copenhagen +5
Stockholm +7
Oslo +1
Brussels +4
Vienna +28
Paris +1
Roma (region) +1
Latest update 5 min ago
Active ads 371,492
474 office spaces found
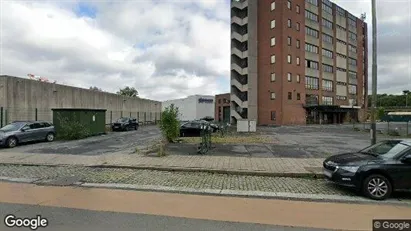
Office space in Stad Gent, Gent
 More info
Office space in Stad Gent, Gent
Office space for rent in Stad Gent, Gent
Areal
-
Pris pr. md.
Ca. 50 EUR pr md
Område
Stad Gent, Gent
Type
Office space
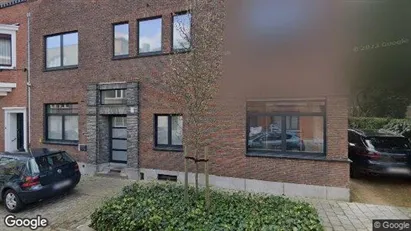
Office space in Stad Gent, Gent
 More info
Office space in Stad Gent, Gent
Office space for rent in Stad Gent, Gent
Areal
Ca. 140 m2
Pris pr. md.
Ca. 200 EUR pr md
Område
Stad Gent, Gent
Type
Office space
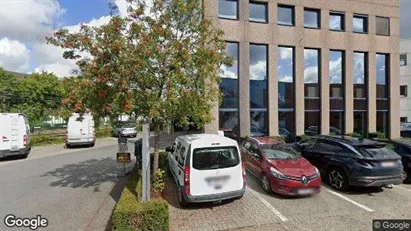
Office space in Gent Sint-Denijs-Westrem, Gent
 More info
Office space in Gent Sint-Denijs-Westrem, Gent
Office space for rent in Gent Sint-Denijs-Westrem, Gent
Areal
Ca. 3,295 m2
Pris pr. md.
Ca. 4,900 EUR pr md
Område
Gent Sint-Denijs-Westrem, Gent
Type
Office space
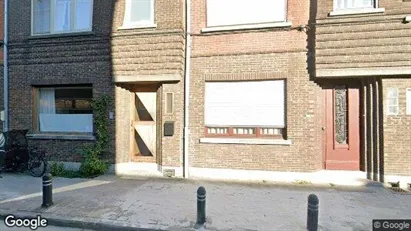
Office space in Stad Gent, Gent
 More info
Office space in Stad Gent, Gent
Office space for rent in Stad Gent, Gent
Areal
-
Pris pr. md.
Ca. 4,750 EUR pr md
Område
Stad Gent, Gent
Type
Office space
Office space in Stad Gent, Gent
 More info
Office space in Stad Gent, Gent
Office space for rent in Stad Gent, Gent
Areal
Ca. 445 m2
Pris pr. md.
Ca. 4,750 EUR pr md
Område
Stad Gent, Gent
Type
Office space
Office space in Stad Gent, Gent
 More info
Office space in Stad Gent, Gent
Office space for rent in Stad Gent, Gent
Areal
Ca. 1,190 m2
Pris pr. md.
Ca. 13,550 EUR pr md
Område
Stad Gent, Gent
Type
Office space
Office space in Stad Gent, Gent
 More info
Office space in Stad Gent, Gent
Office space for rent in Stad Gent, Gent
Areal
Ca. 440 m2
Pris pr. md.
Ca. 4,800 EUR pr md
Område
Stad Gent, Gent
Type
Office space
Office space in Gent Sint-Denijs-Westrem, Gent
 More info
Office space in Gent Sint-Denijs-Westrem, Gent
Office space for rent in Gent Sint-Denijs-Westrem, Gent
Areal
Ca. 675 m2
Pris pr. md.
Ca. 8,400 EUR pr md
Område
Gent Sint-Denijs-Westrem, Gent
Type
Office space
Office space in Stad Gent, Gent
 More info
Office space in Stad Gent, Gent
Office space for rent in Stad Gent, Gent
Areal
-
Pris pr. md.
Ca. 6,350 EUR pr md
Område
Stad Gent, Gent
Type
Office space
Office space in Gent Drongen, Gent
 More info
Office space in Gent Drongen, Gent
Office space for rent in Gent Drongen, Gent
Areal
Ca. 620 m2
Pris pr. md.
Ca. 3,250 EUR pr md
Område
Gent Drongen, Gent
Type
Office space
Office space in Stad Gent, Gent
 More info
Office space in Stad Gent, Gent
Office space for rent in Stad Gent, Gent
Areal
Ca. 235 m2
Pris pr. md.
Ca. 2,950 EUR pr md
Område
Stad Gent, Gent
Type
Office space
Office space in Stad Gent, Gent
 More info
Office space in Stad Gent, Gent
Office space for rent in Stad Gent, Gent
Areal
Ca. 15 m2
Pris pr. md.
Ca. 650 EUR pr md
Område
Stad Gent, Gent
Type
Office space
Office space in Gent Sint-Denijs-Westrem, Gent
 More info
Office space in Gent Sint-Denijs-Westrem, Gent
Office space for rent in Gent Sint-Denijs-Westrem, Gent
Areal
Ca. 255 m2
Pris pr. md.
Ca. 2,850 EUR pr md
Område
Gent Sint-Denijs-Westrem, Gent
Type
Office space
Office space in Stad Gent, Gent
 More info
Office space in Stad Gent, Gent
Office space for rent in Stad Gent, Gent
Areal
Ca. 30 m2
Pris pr. md.
Ca. 700 EUR pr md
Område
Stad Gent, Gent
Type
Office space
Office space in Stad Gent, Gent
 More info
Office space in Stad Gent, Gent
Office space for rent in Stad Gent, Gent
Areal
Ca. 655 m2
Pris pr. md.
Ca. 6,350 EUR pr md
Område
Stad Gent, Gent
Type
Office space
Office space in Gent Drongen, Gent
 More info
Office space in Gent Drongen, Gent
Office space for rent in Gent Drongen, Gent
Areal
Ca. 105 m2
Pris pr. md.
Ca. 700 EUR pr md
Område
Gent Drongen, Gent
Type
Office space
Office space in Gent Drongen, Gent
 More info
Office space in Gent Drongen, Gent
Office space for rent in Gent Drongen, Gent
Areal
Ca. 395 m2
Pris pr. md.
Ca. 2,650 EUR pr md
Område
Gent Drongen, Gent
Type
Office space
Office space in Stad Gent, Gent
 More info
Office space in Stad Gent, Gent
Office space for rent in Stad Gent, Gent
Areal
Ca. 1,800 m2
Pris pr. md.
Ca. 2,400 EUR pr md
Område
Stad Gent, Gent
Type
Office space
Selected customers
30,000 customers use Companyspace.com
30,000 customers
285,000 companies in our database
2,400 rentals annually
Companyspace.com is used by thousands of landlords, property companies, commercial real estate agents, investors and business centres seeking greater visibility, more enquiries and lower vacancy rates.


