


Office space for rentin Brussels
See all office locations for rent, office spaces for rent, office rentals and offices for rent in Brussels below. If you are looking for an office location for rent, office rental, office space for rentor office for rent in Brussels, you have come to the right place. We have most office spaces for rent and for leasein Brussels in our database. Find your new office space for rentin Brussels here. Enjoy.
Companyspace.com today:
New today 796
Updated 24h 1,349
Notifications about new companyspaces1,596
Copenhagen +1
Stockholm +1
Amsterdam +11
Berlin +2
Brussels +5
Vienna +16
Dublin (county) +29
Warsaw +4
Lisbon +1
Latest update 42 min ago
Active ads 368,551
2,016 office spaces found
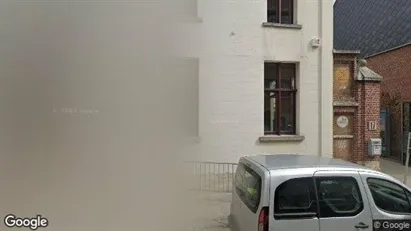
Office space in Brussels Sint-Pieters-Woluwe, Brussels
 More info
Office space in Brussels Sint-Pieters-Woluwe, Brussels
Office space for rent in Brussels Sint-Pieters-Woluwe, Brussels
Areal
Ca. 960 m2
Pris pr. md.
Ca. 12,000 EUR pr md
Område
Brussels Sint-Pieters-Woluwe, Brussels
Type
Office space
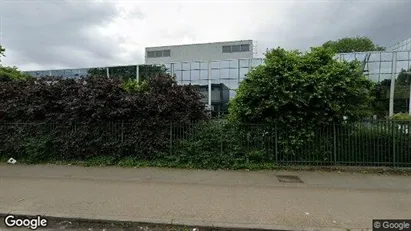
Office space in Brussels Vorst, Brussels
 More info
Office space in Brussels Vorst, Brussels
Office space for rent in Brussels Vorst, Brussels
Areal
Ca. 695 m2
Pris pr. md.
Ca. 7,750 EUR pr md
Område
Brussels Vorst, Brussels
Type
Office space
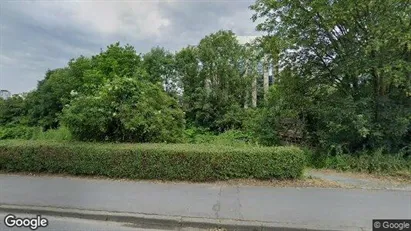
Office space in Stad Brussel, Brussels
 More info
Office space in Stad Brussel, Brussels
Office space for rent in Stad Brussel, Brussels
Areal
Ca. 465 m2
Pris pr. md.
Ca. 7,000 EUR pr md
Område
Stad Brussel, Brussels
Type
Office space
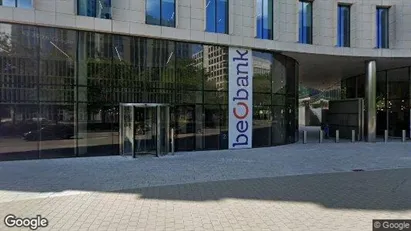
Office space in Brussels Evere, Brussels
 More info
Office space in Brussels Evere, Brussels
Office space for rent in Brussels Evere, Brussels
Areal
Ca. 395 m2
Pris pr. md.
Ca. 3,950 EUR pr md
Område
Brussels Evere, Brussels
Type
Office space
Office space in Brussels Oudergem, Brussels
 More info
Office space in Brussels Oudergem, Brussels
Office space for rent in Brussels Oudergem, Brussels
Areal
Ca. 540 m2
Pris pr. md.
Ca. 6,500 EUR pr md
Område
Brussels Oudergem, Brussels
Type
Office space
Office space in Stad Brussel, Brussels
 More info
Office space in Stad Brussel, Brussels
Office space for rent in Stad Brussel, Brussels
Areal
Ca. 240 m2
Pris pr. md.
Ca. 5,000 EUR pr md
Område
Stad Brussel, Brussels
Type
Office space
Office space in Brussels Anderlecht, Brussels
 More info
Office space in Brussels Anderlecht, Brussels
Office space for rent in Brussels Anderlecht, Brussels
Areal
Ca. 550 m2
Pris pr. md.
Ca. 5,050 EUR pr md
Område
Brussels Anderlecht, Brussels
Type
Office space
Office space in Stad Brussel, Brussels
 More info
Office space in Stad Brussel, Brussels
Office space for rent in Stad Brussel, Brussels
Areal
Ca. 2,320 m2
Pris pr. md.
Ca. 54,150 EUR pr md
Område
Stad Brussel, Brussels
Type
Office space
Office space in Stad Brussel, Brussels
 More info
Office space in Stad Brussel, Brussels
Office space for rent in Stad Brussel, Brussels
Areal
Ca. 575 m2
Pris pr. md.
Ca. 11,100 EUR pr md
Område
Stad Brussel, Brussels
Type
Office space
Office space in Brussels Schaarbeek, Brussels
 More info
Office space in Brussels Schaarbeek, Brussels
Office space for rent in Brussels Schaarbeek, Brussels
Areal
Ca. 830 m2
Pris pr. md.
Ca. 11,750 EUR pr md
Område
Brussels Schaarbeek, Brussels
Type
Office space
Office space in Stad Brussel, Brussels
 More info
Office space in Stad Brussel, Brussels
Office space for rent in Stad Brussel, Brussels
Areal
Ca. 400 m2
Pris pr. md.
Ca. 7,350 EUR pr md
Område
Stad Brussel, Brussels
Type
Office space
Office space in Brussels Schaarbeek, Brussels
 More info
Office space in Brussels Schaarbeek, Brussels
Office space for rent in Brussels Schaarbeek, Brussels
Areal
Ca. 1,895 m2
Pris pr. md.
Ca. 26,850 EUR pr md
Område
Brussels Schaarbeek, Brussels
Type
Office space
Office space in Brussels Etterbeek, Brussels
 More info
Office space in Brussels Etterbeek, Brussels
Office space for rent in Brussels Etterbeek, Brussels
Areal
Ca. 10 m2
Pris pr. md.
Ca. 200 EUR pr md
Område
Brussels Etterbeek, Brussels
Type
Office space
Office space in Brussels Anderlecht, Brussels
 More info
Office space in Brussels Anderlecht, Brussels
Office space for rent in Brussels Anderlecht, Brussels
Areal
Ca. 515 m2
Pris pr. md.
Ca. 5,800 EUR pr md
Område
Brussels Anderlecht, Brussels
Type
Office space
Office space in Stad Brussel, Brussels
 More info
Office space in Stad Brussel, Brussels
Office space for rent in Stad Brussel, Brussels
Areal
Ca. 275 m2
Pris pr. md.
Ca. 2,100 EUR pr md
Område
Stad Brussel, Brussels
Type
Office space
Office space in Brussels Oudergem, Brussels
 More info
Office space in Brussels Oudergem, Brussels
Office space for rent in Brussels Oudergem, Brussels
Areal
Ca. 580 m2
Pris pr. md.
Ca. 8,450 EUR pr md
Område
Brussels Oudergem, Brussels
Type
Office space
Office space in Stad Brussel, Brussels
 More info
Office space in Stad Brussel, Brussels
Office space for rent in Stad Brussel, Brussels
Areal
Ca. 640 m2
Pris pr. md.
Ca. 8,000 EUR pr md
Område
Stad Brussel, Brussels
Type
Office space
Office space in Stad Brussel, Brussels
 More info
Office space in Stad Brussel, Brussels
Office space for rent in Stad Brussel, Brussels
Areal
Ca. 345 m2
Pris pr. md.
Ca. 7,100 EUR pr md
Område
Stad Brussel, Brussels
Type
Office space
Selected customers
30,000 customers use Companyspace.com
30,000 customers
285,000 companies in our database
2,400 rentals annually
Companyspace.com is used by thousands of landlords, property companies, commercial real estate agents, investors and business centres seeking greater visibility, more enquiries and lower vacancy rates.


