


Industrial property for rent in Limbourg
These commercial premises are closest to your search
We currently have no available commercial premises registered that match your search exactly. Therefore, we show below the commercial premises that best match your search based on the current market.
The shown listings may differ from your original search in terms of, for example, premises type, location, size or price, but they have been selected because they may be relevant alternatives for your business.
Take a look at the suggestions below – or start your search again here.
Companyspace.com today:
New today 1,197
Updated 24h 1,197
Notifications about new companyspaces2,019
Copenhagen +34
Stockholm +3
Amsterdam +16
Berlin +4
Brussels +9
Vienna +71
Paris +5
Madrid +3
Dublin (county) +10
Warsaw +24
Lisbon +1
Latest update 20 min ago
Active ads 365,302
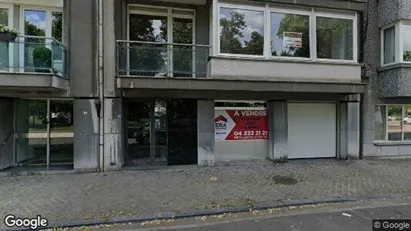
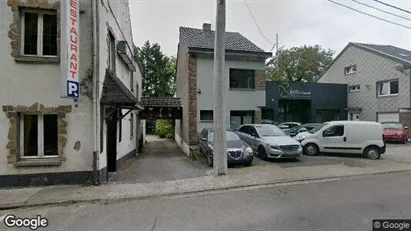
Commercial property in Hoei, Luik (region)
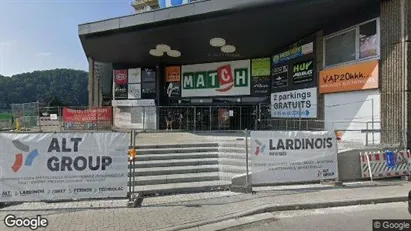 More info
Commercial property in Hoei, Luik (region)
Commercial property for sale in Hoei, Luik (region)
Areal
Ca. 75 m2
Pris
Ca. 99,000EUR
Område
Hoei, Luik (region)
Type
Commercial property
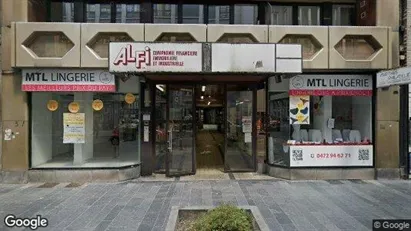
Commercial property in Luik, Luik (region)
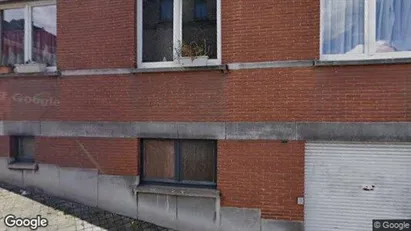 More info
Commercial property in Luik, Luik (region)
Commercial property for sale in Luik, Luik (region)
Areal
Ca. 305 m2
Pris
Ca. 325,000EUR
Område
Luik, Luik (region)
Type
Commercial property
Commercial property in Hoei, Luik (region)
 More info
Commercial property in Hoei, Luik (region)
Commercial property for sale in Hoei, Luik (region)
Areal
Ca. 240 m2
Pris
Ca. 350,000EUR
Område
Hoei, Luik (region)
Type
Commercial property
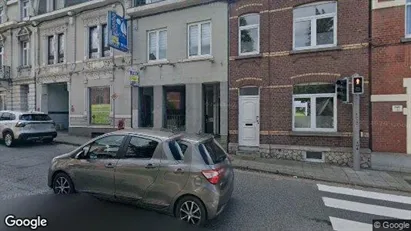
Office property in Borgworm, Luik (region)
 More info
Office property in Borgworm, Luik (region)
Office space for sale in Borgworm, Luik (region)
Areal
Ca. 285 m2
Pris
Ca. 485,000EUR
Område
Borgworm, Luik (region)
Type
Office space
Commercial property in Luik, Luik (region)
 More info
Commercial property in Luik, Luik (region)
Commercial property for sale in Luik, Luik (region)
Areal
-
Pris
Ca. 189,000EUR
Område
Luik, Luik (region)
Type
Commercial property
Office property in Hoei, Luik (region)
 More info
Office property in Hoei, Luik (region)
Office space for sale in Hoei, Luik (region)
Areal
Ca. 100 m2
Pris
Ca. 198,000EUR
Område
Hoei, Luik (region)
Type
Office space
Office property in Luik, Luik (region)
 More info
Office property in Luik, Luik (region)
Office space for sale in Luik, Luik (region)
Areal
Ca. 55 m2
Pris
Ca. 40,000EUR
Område
Luik, Luik (region)
Type
Office space
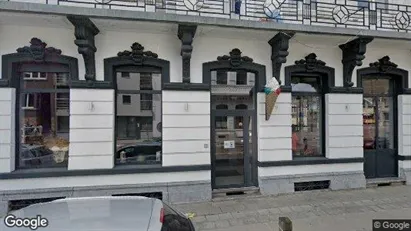
Commercial property in Verviers, Luik (region)
 More info
Commercial property in Verviers, Luik (region)
Commercial property for sale in Verviers, Luik (region)
Areal
Ca. 195 m2
Pris
Ca. 99,000EUR
Område
Verviers, Luik (region)
Type
Commercial property
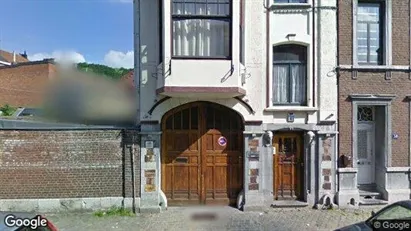
Office space in Luik, Luik (region)
 More info
Office space in Luik, Luik (region)
Office space for rent in Luik, Luik (region)
Areal
Ca. 5 m2
Pris pr. md.
Ca. 50 EUR pr md
Område
Luik, Luik (region)
Type
Office space
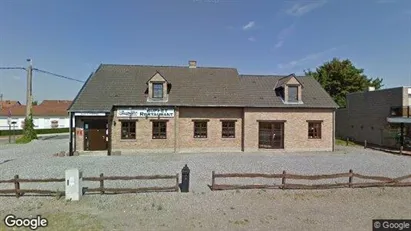
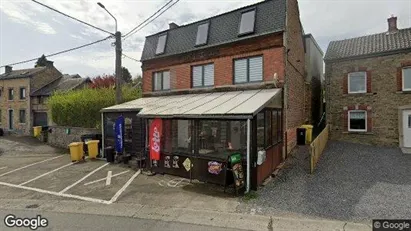
Commercial property in Spa, Luik (region)
 More info
Commercial property in Spa, Luik (region)
Commercial property for sale in Spa, Luik (region)
Areal
Ca. 365 m2
Pris
Ca. 690,000EUR
Område
Spa, Luik (region)
Type
Commercial property
Office property in Luik, Luik (region)
 More info
Office property in Luik, Luik (region)
Office space for sale in Luik, Luik (region)
Areal
Ca. 270 m2
Pris
Ca. 149,000EUR
Område
Luik, Luik (region)
Type
Office space
Office space in Luik, Luik (region)
 More info
Office space in Luik, Luik (region)
Office space for rent in Luik, Luik (region)
Areal
Ca. 20 m2
Pris pr. md.
Ca. 950 EUR pr md
Område
Luik, Luik (region)
Type
Office space
Commercial property in Wezet, Luik (region)
 More info
Commercial property in Wezet, Luik (region)
Commercial property for sale in Wezet, Luik (region)
Areal
-
Pris
Ca. 295,000EUR
Område
Wezet, Luik (region)
Type
Commercial property
Commercial property in Ans, Luik (region)
 More info
Commercial property in Ans, Luik (region)
Commercial property for sale in Ans, Luik (region)
Areal
Ca. 350 m2
Pris
Ca. 650,000EUR
Område
Ans, Luik (region)
Type
Commercial property
Office property in Blégny, Luik (region)
 More info
Office property in Blégny, Luik (region)
Office space for sale in Blégny, Luik (region)
Areal
Ca. 235 m2
Pris
Ca. 219,000EUR
Område
Blégny, Luik (region)
Type
Office space
Warehouse property in Flémalle, Luik (region)
 More info
Warehouse property in Flémalle, Luik (region)
Warehouse for sale in Flémalle, Luik (region)
Areal
Ca. 505 m2
Pris
Ca. 374,000EUR
Område
Flémalle, Luik (region)
Type
Warehouse
Commercial property in Anthisnes, Luik (region)
 More info
Commercial property in Anthisnes, Luik (region)
Commercial property for sale in Anthisnes, Luik (region)
Areal
Ca. 80 m2
Pris
Ca. 129,000EUR
Område
Anthisnes, Luik (region)
Type
Commercial property
Warehouse property in Verviers, Luik (region)
 More info
Warehouse property in Verviers, Luik (region)
Warehouse for sale in Verviers, Luik (region)
Areal
Ca. 210 m2
Pris
Ca. 145,000EUR
Område
Verviers, Luik (region)
Type
Warehouse
Selected customers
30,000 customers use Companyspace.com
30,000 customers
285,000 companies in our database
2,400 rentals annually
Companyspace.com is used by thousands of landlords, property companies, commercial real estate agents, investors and business centres seeking greater visibility, more enquiries and lower vacancy rates.


