


Industrial property for rent in Brussels Oudergem
These commercial premises are closest to your search
We currently have no available commercial premises registered that match your search exactly. Therefore, we show below the commercial premises that best match your search based on the current market.
The shown listings may differ from your original search in terms of, for example, premises type, location, size or price, but they have been selected because they may be relevant alternatives for your business.
Take a look at the suggestions below – or start your search again here.
Companyspace.com today:
New today 875
Updated 24h 2,673
Notifications about new companyspaces6,715
Copenhagen +1
Stockholm +1
Berlin +115
Vienna +12
Roma (region) +1
Greater London +1
Latest update 21 min ago
Active ads 365,845
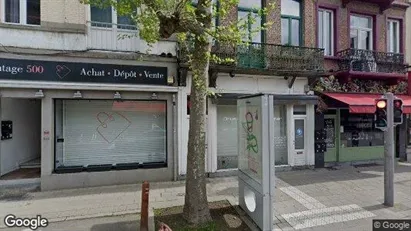
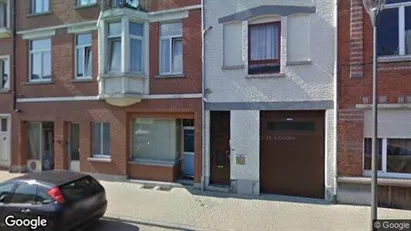
Clinic in Brussels Schaarbeek, Brussels
 More info
Clinic in Brussels Schaarbeek, Brussels
This listing was posted by the landlord through our platform for a fee. VERY IMPORTANDT: To reserve this accommodation, please reply via See picture 2: PLEAS...
Areal
1 - 61 m2
Pris pr. md.
Ca. 50 EUR pr md
Område
Brussels Schaarbeek, Brussels
Type
Clinic
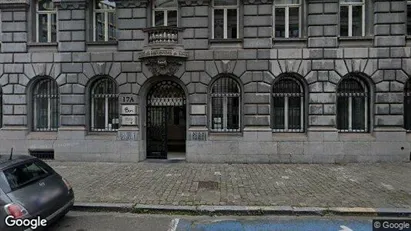
Commercial property in Brussels Elsene, Brussels
 More info
Commercial property in Brussels Elsene, Brussels
Commercial property for sale in Brussels Elsene, Brussels
Areal
Ca. 65 m2
Pris
Ca. 425,000EUR
Område
Brussels Elsene, Brussels
Type
Commercial property
Commercial property in Brussels Etterbeek, Brussels
 More info
Commercial property in Brussels Etterbeek, Brussels
Commercial property for sale in Brussels Etterbeek, Brussels
Areal
Ca. 380 m2
Pris
Ca. 950,000EUR
Område
Brussels Etterbeek, Brussels
Type
Commercial property
Commercial property in Brussels Elsene, Brussels
 More info
Commercial property in Brussels Elsene, Brussels
Commercial property for sale in Brussels Elsene, Brussels
Areal
Ca. 380 m2
Pris
Ca. 1,765,000EUR
Område
Brussels Elsene, Brussels
Type
Commercial property
Commercial property in Brussels Evere, Brussels
 More info
Commercial property in Brussels Evere, Brussels
Commercial property for sale in Brussels Evere, Brussels
Areal
Ca. 130 m2
Pris
Ca. 235,000EUR
Område
Brussels Evere, Brussels
Type
Commercial property
Commercial property in Brussels Schaarbeek, Brussels
 More info
Commercial property in Brussels Schaarbeek, Brussels
Commercial property for sale in Brussels Schaarbeek, Brussels
Areal
Ca. 280 m2
Pris
Ca. 489,000EUR
Område
Brussels Schaarbeek, Brussels
Type
Commercial property
Office space in Brussels Elsene, Brussels
 More info
Office space in Brussels Elsene, Brussels
Office space for rent in Brussels Elsene, Brussels
Areal
Ca. 10 m2
Pris pr. md.
Ca. 150 EUR pr md
Område
Brussels Elsene, Brussels
Type
Office space
Office space in Brussels Elsene, Brussels
 More info
Office space in Brussels Elsene, Brussels
Office space for rent in Brussels Elsene, Brussels
Areal
Ca. 5 m2
Pris pr. md.
Ca. 650 EUR pr md
Område
Brussels Elsene, Brussels
Type
Office space
Office space in Brussels Elsene, Brussels
 More info
Office space in Brussels Elsene, Brussels
Office space for rent in Brussels Elsene, Brussels
Areal
Ca. 15 m2
Pris pr. md.
Ca. 1,450 EUR pr md
Område
Brussels Elsene, Brussels
Type
Office space
Commercial property in Brussels Sint-Jans-Molenbeek, Brussels
 More info
Commercial property in Brussels Sint-Jans-Molenbeek, Brussels
Commercial property for sale in Brussels Sint-Jans-Molenbeek, Brussels
Areal
Ca. 400 m2
Pris
Ca. 1,095,000EUR
Område
Brussels Sint-Jans-Molenbeek, Brussels
Type
Commercial property
Commercial property in Brussels Anderlecht, Brussels
 More info
Commercial property in Brussels Anderlecht, Brussels
Commercial property for sale in Brussels Anderlecht, Brussels
Areal
Ca. 1,000 m2
Pris
Ca. 749,000EUR
Område
Brussels Anderlecht, Brussels
Type
Commercial property
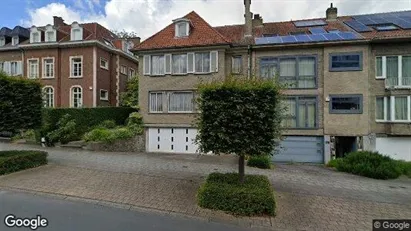
Office property in Stad Brussel, Brussels
 More info
Office property in Stad Brussel, Brussels
Office space for sale in Stad Brussel, Brussels
Areal
Ca. 185 m2
Pris
Ca. 719,000EUR
Område
Stad Brussel, Brussels
Type
Office space
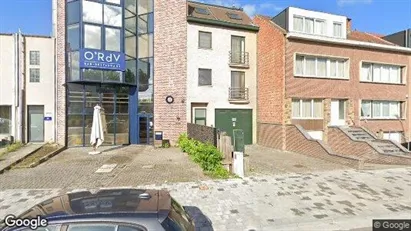
Commercial property in Stad Brussel, Brussels
 More info
Commercial property in Stad Brussel, Brussels
Commercial property for sale in Stad Brussel, Brussels
Areal
Ca. 275 m2
Pris
Ca. 963,000EUR
Område
Stad Brussel, Brussels
Type
Commercial property
Office space in Brussels Sint-Jans-Molenbeek, Brussels
 More info
Office space in Brussels Sint-Jans-Molenbeek, Brussels
Office space for rent in Brussels Sint-Jans-Molenbeek, Brussels
Areal
-
Pris pr. md.
Ca. 250 EUR pr md
Område
Brussels Sint-Jans-Molenbeek, Brussels
Type
Office space
Commercial property in Brussels Schaarbeek, Brussels
 More info
Commercial property in Brussels Schaarbeek, Brussels
Commercial property for sale in Brussels Schaarbeek, Brussels
Areal
Ca. 400 m2
Pris
Ca. 1,140,000EUR
Område
Brussels Schaarbeek, Brussels
Type
Commercial property
Commercial property in Brussels Anderlecht, Brussels
 More info
Commercial property in Brussels Anderlecht, Brussels
Commercial property for sale in Brussels Anderlecht, Brussels
Areal
Ca. 375 m2
Pris
Ca. 250,000EUR
Område
Brussels Anderlecht, Brussels
Type
Commercial property
Office space in Stad Brussel, Brussels
 More info
Office space in Stad Brussel, Brussels
Office space for rent in Stad Brussel, Brussels
Areal
Ca. 1,565 m2
Pris pr. md.
Ca. 28,000 EUR pr md
Område
Stad Brussel, Brussels
Type
Office space
Office space in Brussels Sint-Joost-ten-Node, Brussels
 More info
Office space in Brussels Sint-Joost-ten-Node, Brussels
Office space for rent in Brussels Sint-Joost-ten-Node, Brussels
Areal
Ca. 1,780 m2
Pris pr. md.
Ca. 25,950 EUR pr md
Område
Brussels Sint-Joost-ten-Node, Brussels
Type
Office space
Selected customers
30,000 customers use Companyspace.com
30,000 customers
285,000 companies in our database
2,400 rentals annually
Companyspace.com is used by thousands of landlords, property companies, commercial real estate agents, investors and business centres seeking greater visibility, more enquiries and lower vacancy rates.


