


Commercial property for rent in Waregem
There are 37 available commercial propertiesin Waregem right now. Companyspace.com collects commercial properties from many different parts of the market, so that you as a company can more easily get an overview of available commercial propertiesin Waregem.
Companyspace.com today:
New today 852
Updated 24h 1,227
Notifications about new companyspaces1,644
Copenhagen +3
Stockholm +1
Amsterdam +3
Berlin +3
Brussels +6
Vienna +16
Paris +1
Madrid +12
Dublin (county) +11
Warsaw +7
Roma (region) +3
Lisbon +1
Latest update 33 min ago
Active ads 365,010
37 commercial properties found
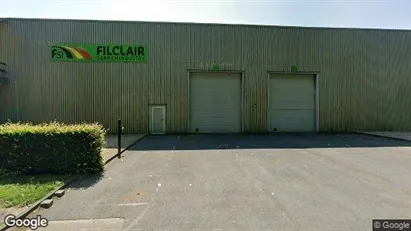
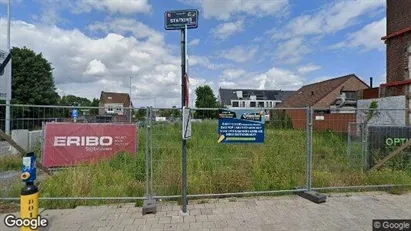
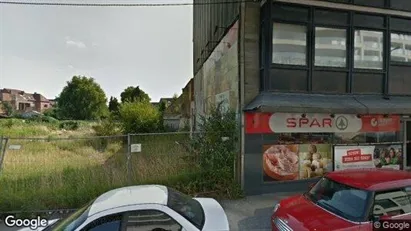
Commercial space in Waregem, West-Vlaanderen
 More info
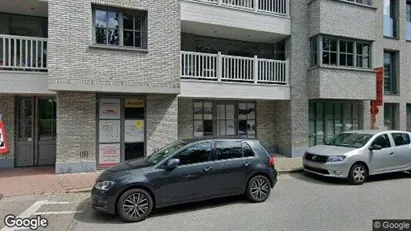
Commercial space in Waregem, West-Vlaanderen
Commercial space for rent in Waregem, West-Vlaanderen
Areal
Ca. 340 m2
Pris pr. md.
Not stated
Område
Waregem, West-Vlaanderen
Type
Commercial property
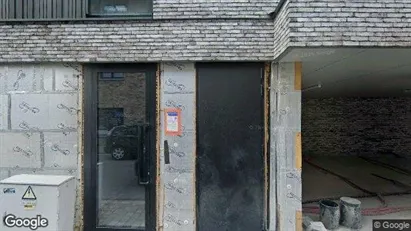
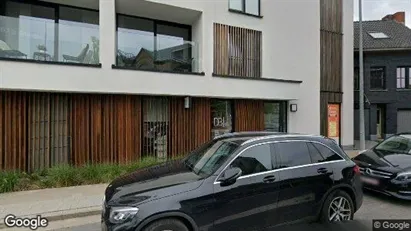
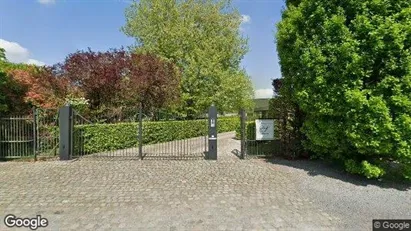
Commercial space in Waregem, West-Vlaanderen
 More info
Commercial space in Waregem, West-Vlaanderen
Commercial space for rent in Waregem, West-Vlaanderen
Areal
Ca. 3,695 m2
Pris pr. md.
Not stated
Område
Waregem, West-Vlaanderen
Type
Commercial property
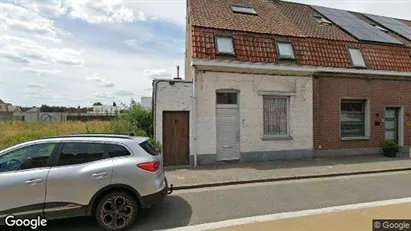
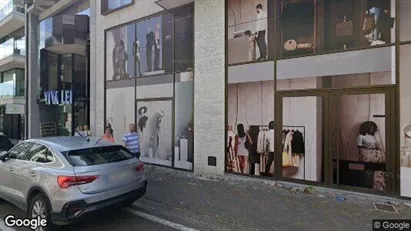
Commercial space in Waregem, West-Vlaanderen
 More info
Commercial space in Waregem, West-Vlaanderen
Commercial space for rent in Waregem, West-Vlaanderen
Areal
Ca. 80 m2
Pris pr. md.
Not stated
Område
Waregem, West-Vlaanderen
Type
Commercial property
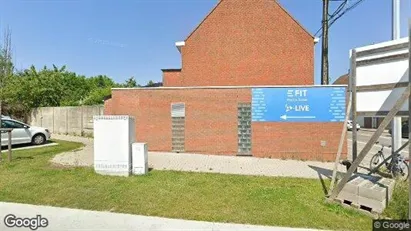
Commercial space in Waregem, West-Vlaanderen
 More info
Commercial space in Waregem, West-Vlaanderen
Commercial space for rent in Waregem, West-Vlaanderen
Areal
-
Pris pr. md.
Not stated
Område
Waregem, West-Vlaanderen
Type
Commercial property
Commercial space in Waregem, West-Vlaanderen
 More info
Commercial space in Waregem, West-Vlaanderen
Commercial space for rent in Waregem, West-Vlaanderen
Areal
-
Pris pr. md.
Not stated
Område
Waregem, West-Vlaanderen
Type
Commercial property
Commercial space in Waregem, West-Vlaanderen
 More info
Commercial space in Waregem, West-Vlaanderen
Commercial space for rent in Waregem, West-Vlaanderen
Areal
Ca. 85 m2
Pris pr. md.
Not stated
Område
Waregem, West-Vlaanderen
Type
Commercial property
Commercial space in Waregem, West-Vlaanderen
 More info
Commercial space in Waregem, West-Vlaanderen
Commercial space for rent in Waregem, West-Vlaanderen
Areal
-
Pris pr. md.
Not stated
Område
Waregem, West-Vlaanderen
Type
Commercial property
Commercial space in Waregem, West-Vlaanderen
 More info
Commercial space in Waregem, West-Vlaanderen
Commercial space for rent in Waregem, West-Vlaanderen
Areal
Ca. 75 m2
Pris pr. md.
Not stated
Område
Waregem, West-Vlaanderen
Type
Commercial property
Commercial space in Waregem, West-Vlaanderen
 More info
Commercial space in Waregem, West-Vlaanderen
Commercial space for rent in Waregem, West-Vlaanderen
Areal
Ca. 165 m2
Pris pr. md.
Not stated
Område
Waregem, West-Vlaanderen
Type
Commercial property
Commercial space in Waregem, West-Vlaanderen
 More info
Commercial space in Waregem, West-Vlaanderen
Commercial space for rent in Waregem, West-Vlaanderen
Areal
-
Pris pr. md.
Not stated
Område
Waregem, West-Vlaanderen
Type
Commercial property
Commercial space in Waregem, West-Vlaanderen
 More info
Commercial space in Waregem, West-Vlaanderen
Commercial space for rent in Waregem, West-Vlaanderen
Areal
Ca. 120 m2
Pris pr. md.
Not stated
Område
Waregem, West-Vlaanderen
Type
Commercial property
Commercial space in Waregem, West-Vlaanderen
 More info
Commercial space in Waregem, West-Vlaanderen
Commercial space for rent in Waregem, West-Vlaanderen
Areal
Ca. 135 m2
Pris pr. md.
Not stated
Område
Waregem, West-Vlaanderen
Type
Commercial property
Commercial space in Waregem, West-Vlaanderen
 More info
Commercial space in Waregem, West-Vlaanderen
Commercial space for rent in Waregem, West-Vlaanderen
Areal
Ca. 120 m2
Pris pr. md.
Not stated
Område
Waregem, West-Vlaanderen
Type
Commercial property
Commercial space in Waregem, West-Vlaanderen
 More info
Commercial space in Waregem, West-Vlaanderen
Commercial space for rent in Waregem, West-Vlaanderen
Areal
Ca. 1,535 m2
Pris pr. md.
Not stated
Område
Waregem, West-Vlaanderen
Type
Commercial property
Commercial space in Waregem, West-Vlaanderen
 More info
Commercial space in Waregem, West-Vlaanderen
Commercial space for rent in Waregem, West-Vlaanderen
Areal
Ca. 985 m2
Pris pr. md.
Not stated
Område
Waregem, West-Vlaanderen
Type
Commercial property
Commercial space in Waregem, West-Vlaanderen
 More info
Commercial space in Waregem, West-Vlaanderen
Commercial space for rent in Waregem, West-Vlaanderen
Areal
Ca. 3,300 m2
Pris pr. md.
Not stated
Område
Waregem, West-Vlaanderen
Type
Commercial property
Commercial space in Waregem, West-Vlaanderen
More info
Commercial space in Waregem, West-Vlaanderen
Commercial space for rent in Waregem, West-Vlaanderen
Areal
Ca. 10,000 m2
Pris pr. md.
Not stated
Område
Waregem, West-Vlaanderen
Type
Commercial property
Commercial space in Waregem, West-Vlaanderen
More info
Commercial space in Waregem, West-Vlaanderen
Commercial space for rent in Waregem, West-Vlaanderen
Areal
Ca. 400 m2
Pris pr. md.
Not stated
Område
Waregem, West-Vlaanderen
Type
Commercial property
Selected customers
Selected customers
30,000 customers use Companyspace.com
30,000 customers
285,000 companies in our database
2,400 rentals annually
Companyspace.com is used by thousands of landlords, property companies, commercial real estate agents, investors and business centres seeking greater visibility, more enquiries and lower vacancy rates.


