


Commercial property for rent in Horebeke
These commercial premises are closest to your search
We currently have no available commercial premises registered that match your search exactly. Therefore, we show below the commercial premises that best match your search based on the current market.
The shown listings may differ from your original search in terms of, for example, premises type, location, size or price, but they have been selected because they may be relevant alternatives for your business.
Take a look at the suggestions below – or start your search again here.
Companyspace.com today:
New today 2,808
Updated 24h 2,808
Notifications about new companyspaces2,241
Copenhagen +18
Stockholm +6
Berlin +19
Oslo +2
Brussels +30
Vienna +41
Madrid +1
Dublin (county) +20
Warsaw +1
Latest update 1 min ago
Active ads 320,917
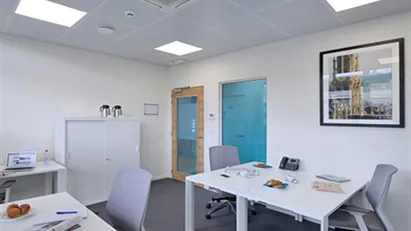
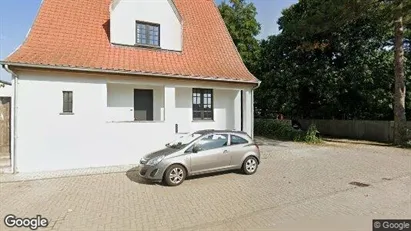
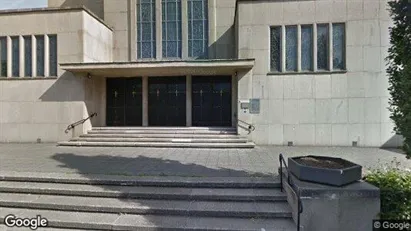
Office space in Temse, Oost-Vlaanderen
 More info
Office space in Temse, Oost-Vlaanderen
HISTORIEK: gebouw in de Kouterstraat 33 in 9140 Temse.
Gebouwd +/- 1985 als groot commercieel ruimtes in hoofdstraat Temse.
Een gelijkvloer EN 1st verdie...
Areal
Ca. 800 m2
Pris pr. md.
Ca. 7,000 EUR pr md
Område
Temse, Oost-Vlaanderen
Type
Office space
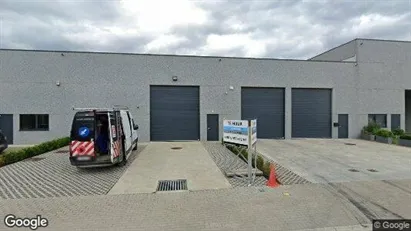
Commercial space in Aalst, Oost-Vlaanderen
 More info
Commercial space in Aalst, Oost-Vlaanderen
Bent u op zoek naar een ruime en vlot bereikbare KMO-unit? Deze loods van 825 m² in Aalst is dan de ideale plek voor uw bedrijf. Gelegen op een semi-industri...
Areal
Ca. 825 m2
Pris pr. md.
Ca. 3,800 EUR pr md
Område
Aalst, Oost-Vlaanderen
Type
Commercial property
Coworking space in Sint-Niklaas, Oost-Vlaanderen
 More info
Coworking space in Sint-Niklaas, Oost-Vlaanderen
Finding a workspace for rent is quick and easy | Courtesy of MatchOffice
Are you looking for workspace for rent in Belgium? MatchOffice is not just a platfo...
Areal
1 - 30 locations
Pris pr. md.
Ca. 200 EUR/mo
Område
Sint-Niklaas, Oost-Vlaanderen
Type
Coworking space
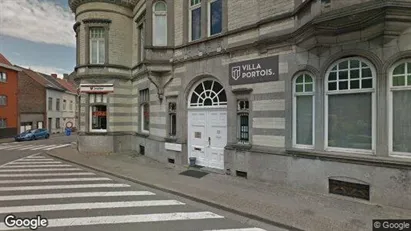
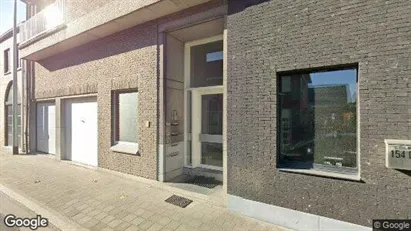
Clinic in Temse, Oost-Vlaanderen
 More info
Clinic in Temse, Oost-Vlaanderen
Instapklare en verzorgde praktijkruimte met natuurlijk licht, ideaal voor beautybehandelingen, coaching of therapie,headspa, haar behandelingen.
Inbegrepen ...
Areal
Ca. 15 m2
Pris pr. md.
Ca. 400 EUR pr md
Område
Temse, Oost-Vlaanderen
Type
Clinic
Commercial space in Deinze, Oost-Vlaanderen
 More info
Commercial space in Deinze, Oost-Vlaanderen
Ruime lichtrijke ruimtes al met toestellen geïnstalleerd, mooie tuin.
Boven vrije bureelruimtes en 2 polyvalente ruimtes.
2 toiletten en 1 douche-en kleed...
Areal
Ca. 220 m2
Pris pr. md.
Not stated
Område
Deinze, Oost-Vlaanderen
Type
Commercial property
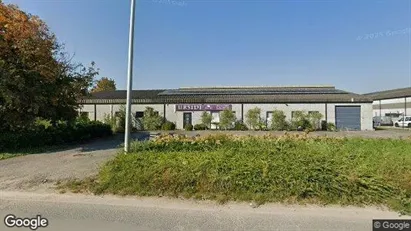
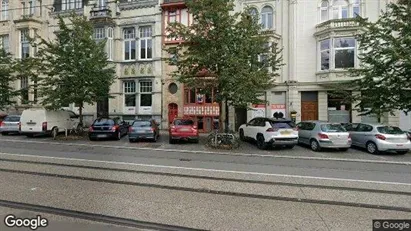
Restaurant in Lokeren, Oost-Vlaanderen
More info
We monitor the market!
Restaurant in Lokeren, Oost-Vlaanderen
Mooie ruimte met een ziel te huur in een groene omgeving en rustige straat te Lokeren. De ruimte is gelegen in mooie burgerswoning op het eerste verdiep, wel...
Areal
100 - 300 m2
Pris pr. md.
Not stated
Område
Lokeren, Oost-Vlaanderen
Type
Restaurant
Clinic in Gent Mariakerke, Gent
More info
We monitor the market!
Clinic in Gent Mariakerke, Gent
Two fully equipped practice rooms at Ground & Glow, Brugsesteenweg 585 in Mariakerke.
You bring nothing. Only yourself and your client.
Each room comes wit...
Areal
Ca. 15 m2
Pris pr. md.
Not stated
Område
Gent Mariakerke, Gent
Type
Clinic
Commercial property in Lokeren, Oost-Vlaanderen
 More info
Commercial property in Lokeren, Oost-Vlaanderen
Commercial property for sale in Lokeren, Oost-Vlaanderen
Areal
Ca. 1,350 m2
Pris
Ca. 2,150,000EUR
Område
Lokeren, Oost-Vlaanderen
Type
Commercial property
Commercial property in Ronse, Oost-Vlaanderen
 More info
Commercial property in Ronse, Oost-Vlaanderen
Commercial property for sale in Ronse, Oost-Vlaanderen
Areal
Ca. 450 m2
Pris
Ca. 450,000EUR
Område
Ronse, Oost-Vlaanderen
Type
Commercial property
Commercial property in Lebbeke, Oost-Vlaanderen
 More info
Commercial property in Lebbeke, Oost-Vlaanderen
Commercial property for sale in Lebbeke, Oost-Vlaanderen
Areal
Ca. 535 m2
Pris
Ca. 750,000EUR
Område
Lebbeke, Oost-Vlaanderen
Type
Commercial property
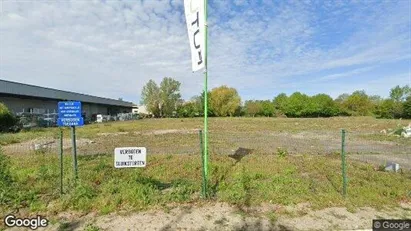
Warehouse in Dendermonde, Oost-Vlaanderen
 More info
Warehouse in Dendermonde, Oost-Vlaanderen
Warehouse for rent in Dendermonde, Oost-Vlaanderen
Areal
Ca. 6,900 m2
Pris pr. md.
Ca. 13,000 EUR pr md
Område
Dendermonde, Oost-Vlaanderen
Type
Warehouse
Office property in Lokeren, Oost-Vlaanderen
 More info
Office property in Lokeren, Oost-Vlaanderen
Office space for sale in Lokeren, Oost-Vlaanderen
Areal
Ca. 105 m2
Pris
Ca. 130,000EUR
Område
Lokeren, Oost-Vlaanderen
Type
Office space
Office property in Hamme, Oost-Vlaanderen
 More info
Office property in Hamme, Oost-Vlaanderen
Office space for sale in Hamme, Oost-Vlaanderen
Areal
Ca. 605 m2
Pris
Ca. 350,000EUR
Område
Hamme, Oost-Vlaanderen
Type
Office space
Office property in Aalter, Oost-Vlaanderen
 More info
Office property in Aalter, Oost-Vlaanderen
Office space for sale in Aalter, Oost-Vlaanderen
Areal
Ca. 85 m2
Pris
Ca. 164,000EUR
Område
Aalter, Oost-Vlaanderen
Type
Office space
Commercial property in Sint-Niklaas, Oost-Vlaanderen
 More info
Commercial property in Sint-Niklaas, Oost-Vlaanderen
Commercial property for sale in Sint-Niklaas, Oost-Vlaanderen
Areal
Ca. 210 m2
Pris
Ca. 199,000EUR
Område
Sint-Niklaas, Oost-Vlaanderen
Type
Commercial property
Commercial property in Hamme, Oost-Vlaanderen
 More info
Commercial property in Hamme, Oost-Vlaanderen
Commercial property for sale in Hamme, Oost-Vlaanderen
Areal
Ca. 450 m2
Pris
Ca. 399,000EUR
Område
Hamme, Oost-Vlaanderen
Type
Commercial property
Office property in Stad Gent, Gent
 More info
Office property in Stad Gent, Gent
Office space for sale in Stad Gent, Gent
Areal
Ca. 125 m2
Pris
Ca. 195,000EUR
Område
Stad Gent, Gent
Type
Office space
Commercial property in Laarne, Oost-Vlaanderen
 More info
Commercial property in Laarne, Oost-Vlaanderen
Commercial property for sale in Laarne, Oost-Vlaanderen
Areal
Ca. 180 m2
Pris
Ca. 351,000EUR
Område
Laarne, Oost-Vlaanderen
Type
Commercial property
Selected customers
30,000 customers use Companyspace.com
30,000 customers
285,000 companies in our database
2,400 rentals annually
Companyspace.com is used by thousands of landlords, property companies, commercial real estate agents, investors and business centres seeking greater visibility, more enquiries and lower vacancy rates.


