


Warehouses in Belgium
Companyspace.com today:
New today 870
Updated 24h 3,475
Notifications about new companyspaces6,708
Copenhagen +1
Stockholm +1
Berlin +115
Vienna +12
Roma (region) +1
Greater London +1
Latest update 14 min ago
Active ads 365,805
1,795 warehouses found
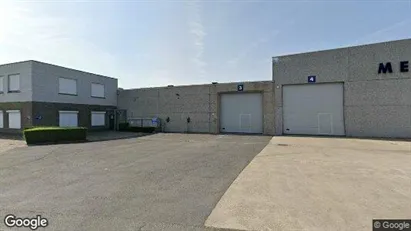
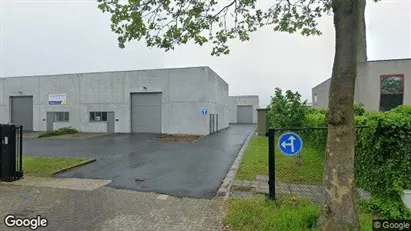
Warehouse in Kruisem, Oost-Vlaanderen
 More info
Warehouse in Kruisem, Oost-Vlaanderen
Warehouse for rent in Kruisem, Oost-Vlaanderen
Areal
Ca. 220 m2
Pris pr. md.
Ca. 2,650 EUR pr md
Område
Kruisem, Oost-Vlaanderen
Type
Warehouse
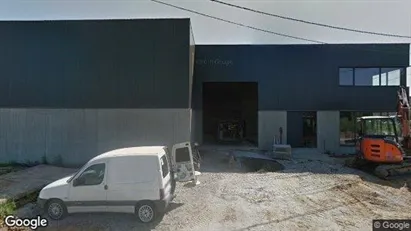
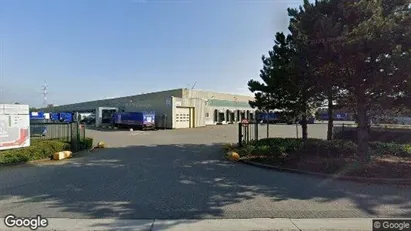
Warehouse in Kuurne, West-Vlaanderen
 More info
Warehouse in Kuurne, West-Vlaanderen
Warehouse for rent in Kuurne, West-Vlaanderen
Areal
Ca. 120 m2
Pris pr. md.
Ca. 1,800 EUR pr md
Område
Kuurne, West-Vlaanderen
Type
Warehouse
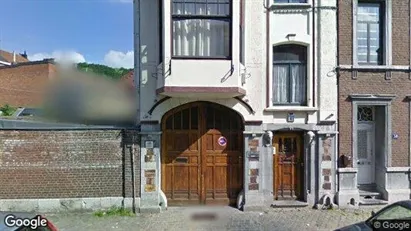
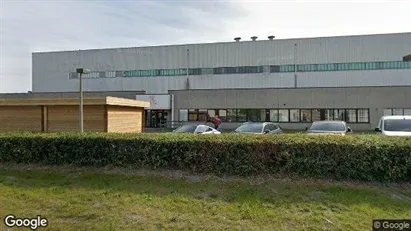
Warehouse in Kruisem, Oost-Vlaanderen
 More info
Warehouse in Kruisem, Oost-Vlaanderen
Warehouse for rent in Kruisem, Oost-Vlaanderen
Areal
Ca. 220 m2
Pris pr. md.
Ca. 7,150 EUR pr md
Område
Kruisem, Oost-Vlaanderen
Type
Warehouse
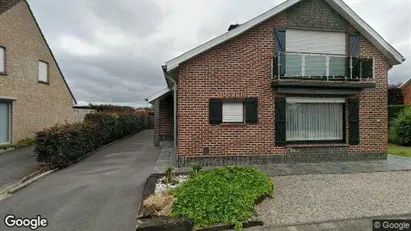
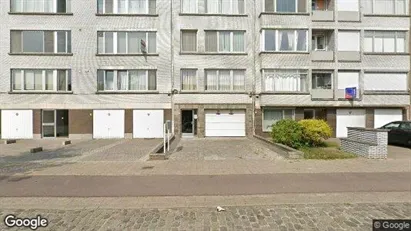
Warehouse in Wielsbeke, West-Vlaanderen
 More info
Warehouse in Wielsbeke, West-Vlaanderen
Warehouse for rent in Wielsbeke, West-Vlaanderen
Areal
Ca. 120 m2
Pris pr. md.
Ca. 950 EUR pr md
Område
Wielsbeke, West-Vlaanderen
Type
Warehouse
Warehouse property in Verviers, Luik (region)
 More info
Warehouse property in Verviers, Luik (region)
Warehouse for sale in Verviers, Luik (region)
Areal
Ca. 210 m2
Pris
Ca. 145,000EUR
Område
Verviers, Luik (region)
Type
Warehouse
Warehouse property in Ledegem, West-Vlaanderen
 More info
Warehouse property in Ledegem, West-Vlaanderen
Warehouse for sale in Ledegem, West-Vlaanderen
Areal
Ca. 205 m2
Pris
Ca. 87,000EUR
Område
Ledegem, West-Vlaanderen
Type
Warehouse
Warehouse property in Antwerp Deurne, Antwerp
 More info
Warehouse property in Antwerp Deurne, Antwerp
Warehouse for sale in Antwerp Deurne, Antwerp
Areal
Ca. 800 m2
Pris
Ca. 340,000EUR
Område
Antwerp Deurne, Antwerp
Type
Warehouse
Warehouse property in Houthulst, West-Vlaanderen
 More info
Warehouse property in Houthulst, West-Vlaanderen
Warehouse for sale in Houthulst, West-Vlaanderen
Areal
Ca. 715 m2
Pris
Ca. 495,000EUR
Område
Houthulst, West-Vlaanderen
Type
Warehouse
Warehouse property in Ieper, West-Vlaanderen
 More info
Warehouse property in Ieper, West-Vlaanderen
Warehouse for sale in Ieper, West-Vlaanderen
Areal
Ca. 2,610 m2
Pris
Ca. 575,000EUR
Område
Ieper, West-Vlaanderen
Type
Warehouse
Warehouse property in Boom, Antwerp (Province)
 More info
Warehouse property in Boom, Antwerp (Province)
Warehouse for sale in Boom, Antwerp (Province)
Areal
Ca. 220 m2
Pris
Ca. 495,000EUR
Område
Boom, Antwerp (Province)
Type
Warehouse
Warehouse property in Jabbeke, West-Vlaanderen
 More info
Warehouse property in Jabbeke, West-Vlaanderen
Warehouse for sale in Jabbeke, West-Vlaanderen
Areal
Ca. 260 m2
Pris
Ca. 419,000EUR
Område
Jabbeke, West-Vlaanderen
Type
Warehouse
Warehouse in Heusden-Zolder, Limburg
 More info
Warehouse in Heusden-Zolder, Limburg
Warehouse for rent in Heusden-Zolder, Limburg
Areal
Ca. 2,285 m2
Pris pr. md.
Ca. 10,950 EUR pr md
Område
Heusden-Zolder, Limburg
Type
Warehouse
Warehouse in Brugge, West-Vlaanderen
 More info
Warehouse in Brugge, West-Vlaanderen
Warehouse for rent in Brugge, West-Vlaanderen
Areal
-
Pris pr. md.
Ca. 4,000 EUR pr md
Område
Brugge, West-Vlaanderen
Type
Warehouse
Warehouse property in Antwerp Merksem, Antwerp
 More info
Warehouse property in Antwerp Merksem, Antwerp
Warehouse for sale in Antwerp Merksem, Antwerp
Areal
Ca. 65 m2
Pris
Ca. 75,000EUR
Område
Antwerp Merksem, Antwerp
Type
Warehouse
Warehouse property in Kortessem, Limburg
 More info
Warehouse property in Kortessem, Limburg
Warehouse for sale in Kortessem, Limburg
Areal
Ca. 325 m2
Pris
Ca. 607,000EUR
Område
Kortessem, Limburg
Type
Warehouse
Warehouse property in Sint-Gillis-Waas, Oost-Vlaanderen
 More info
Warehouse property in Sint-Gillis-Waas, Oost-Vlaanderen
Warehouse for sale in Sint-Gillis-Waas, Oost-Vlaanderen
Areal
Ca. 235 m2
Pris
Ca. 405,000EUR
Område
Sint-Gillis-Waas, Oost-Vlaanderen
Type
Warehouse
Warehouse in Londerzeel, Vlaams-Brabant
 More info
Warehouse in Londerzeel, Vlaams-Brabant
Warehouse for rent in Londerzeel, Vlaams-Brabant
Areal
Ca. 6,795 m2
Pris pr. md.
Ca. 16,700 EUR pr md
Område
Londerzeel, Vlaams-Brabant
Type
Warehouse
Warehouse in Gistel, West-Vlaanderen
 More info
Warehouse in Gistel, West-Vlaanderen
Warehouse for rent in Gistel, West-Vlaanderen
Areal
-
Pris pr. md.
Ca. 1,750 EUR pr md
Område
Gistel, West-Vlaanderen
Type
Warehouse
Selected customers
30,000 customers use Companyspace.com
30,000 customers
285,000 companies in our database
2,400 rentals annually
Companyspace.com is used by thousands of landlords, property companies, commercial real estate agents, investors and business centres seeking greater visibility, more enquiries and lower vacancy rates.


