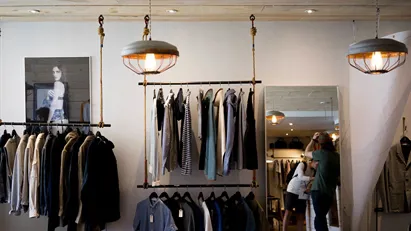
Available shops in Belgium
See available shop locations, retail spaces and retail premises in all of Belgium below. If you are looking for available premises for a shop, store or retail property in Belgium, you have come to the right place. We have most available retail spaces and store locations in Belgium in our database. Find your retail space in Belgium here. Enjoy. More info about shop and retail locations in Belgium.
-
151 m2 shop for rent in Bilzen, Limburg
- 1,675 EUR per month
- 133.11 EUR /m2/year
-
682 m2 shop for rent in Schoten, Antwerp (Province)
- 4,500 EUR per month
- 79.18 EUR /m2/year
-
112 m2 shop for rent in Brasschaat, Antwerp (Province)
- 2,050 EUR per month
- 219.64 EUR /m2/year
-
1000 m2 shop for rent in Lier, Antwerp (Province)
- 8,333 EUR per month
- 100 EUR /m2/year
-
295 m2 shop for rent in Hasselt, Limburg
- 1,750 EUR per month
- 71.19 EUR /m2/year
-
1268 m2 shop for rent in Schoten, Antwerp (Province)
- 21,133 EUR per month
- 200 EUR /m2/year
-
2054 m2 shop for rent in Aartselaar, Antwerp (Province)
- 18,500 EUR per month
- 108.08 EUR /m2/year
-
396 m2 shop for rent in Landen, Vlaams-Brabant
- 1,200 EUR per month
- 36.36 EUR /m2/year
-
850 m2 shop for rent in Roeselare, West-Vlaanderen
- 11,666 EUR per month
- 164.70 EUR /m2/year
-
1177 m2 shop for rent in Aartselaar, Antwerp (Province)
- 11,450 EUR per month
- 116.74 EUR /m2/year
-
700 m2 shop for rent in Kuurne, West-Vlaanderen
- 4,500 EUR per month
- 77.14 EUR /m2/year
Frequently asked questions
Statistics on the development of available shops for rent in Belgium over the past month
Also see aggregate statistics on all available shops in Belgium over time, aggregate statistics on new shops in Belgium over time, aggregate statistics on rented shops in Belgium over time
| Date | |||
|---|---|---|---|
| 30. December 2025 | 459 | 10 | 21 |
| 29. December 2025 | 470 | 5 | 7 |
| 28. December 2025 | 472 | 10 | 8 |
| 27. December 2025 | 470 | 3 | 7 |
| 26. December 2025 | 474 | 2 | 3 |
| 25. December 2025 | 475 | 2 | 3 |
| 24. December 2025 | 476 | 4 | 302 |
| 23. December 2025 | 774 | 0 | 3 |
| 22. December 2025 | 777 | 12 | 14 |
| 21. December 2025 | 779 | 58 | 0 |
| 20. December 2025 | 721 | 4 | 53 |
| 19. December 2025 | 770 | 7 | 21 |
| 18. December 2025 | 784 | 0 | 0 |
| 17. December 2025 | 784 | 4 | 2 |
| 16. December 2025 | 782 | 9 | 7 |
| 15. December 2025 | 780 | 2 | 0 |
| 14. December 2025 | 778 | 3 | 3 |
| 13. December 2025 | 778 | 4 | 2 |
| 12. December 2025 | 776 | 12 | 0 |
| 11. December 2025 | 764 | 4 | 14 |
| 10. December 2025 | 774 | 0 | 2 |
| 9. December 2025 | 776 | 15 | 8 |
| 8. December 2025 | 769 | 16 | 14 |
| 7. December 2025 | 767 | 6 | 0 |
| 6. December 2025 | 761 | 4 | 2 |
| 5. December 2025 | 759 | 3 | 0 |
| 4. December 2025 | 756 | 4 | 12 |
| 3. December 2025 | 764 | 9 | 7 |
| 2. December 2025 | 762 | 4 | 0 |
| 1. December 2025 | 758 | 5 | 9 |
| 30. November 2025 | 762 | 0 | 0 |
Statistics on currently available shops in Belgium
Also see gathered statistics of all available shops over time, the gathered statistics of new shops over time, the gathered statistics of rented shops over time
| Shops | |
|---|---|
| Available premises | 455 |
| New premises since yesterday | 10 |
| Rented out premises since yesterday | 21 |
| Total available m2 | 195,327 |
| Average price per m2 per year without expenses | 345 |
| Highest price per m2 per year | 32,307.69 |
| Lowest price per m2 per year | 12.15 |


