Available industrial properties in Belgium
See all available industrial properties in Belgium below. If you are looking for industrial property in Belgium, you have come to the right place. We have most available industrial properties in Belgium in our database. Find industrial property in Belgium here. Enjoy.
154 industrial properties found
-
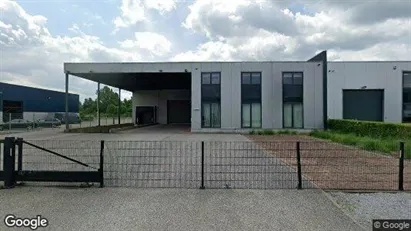
110 m2 industrial property for rent in Stad Gent, Gent
- 12,500 EUR per month
- 1,363.64 EUR /m2/year
-
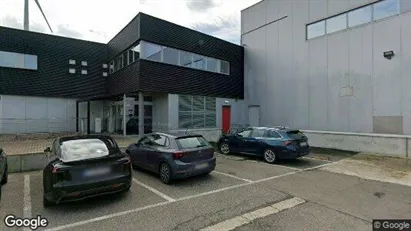
270 m2 industrial property for rent in Stad Gent, Gent
- 3,500 EUR per month
- 155.56 EUR /m2/year
-
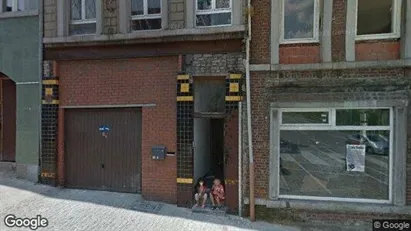
110 m2 industrial property for rent in Anzegem, West-Vlaanderen
- 1,250 EUR per month
- 136.36 EUR /m2/year
-
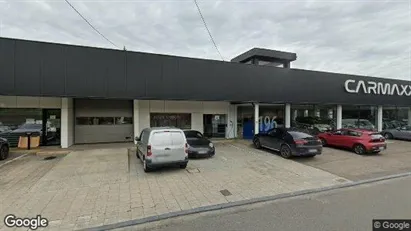
6522 m2 industrial property for rent in Brussels Ukkel, Brussels
- 20,542 EUR per month
- 37.80 EUR /m2/year
-
1 m2 industrial property for rent in Luik, Luik (region)
- 340 EUR per month
- 4,080 EUR /m2/year
-
1 m2 industrial property for rent in Luik, Luik (region)
- 340 EUR per month
- 4,080 EUR /m2/year
-
31016 m2 office space for rent in Stad Gent, Gent
- 6,900 EUR per month
- 2.67 EUR /m2/year
-
245 m2 industrial property for rent in Ardooie, West-Vlaanderen
- 22,000 EUR per month
- 1,077.55 EUR /m2/year
-
70 m2 office space for rent in Sint-Niklaas, Oost-Vlaanderen
- 1,100 EUR per month
- 188.57 EUR /m2/year
-
2251 m2 industrial property for rent in Balen, Antwerp (Province)
- 542 EUR per month
- 2.89 EUR /m2/year
-
720 m2 industrial property for rent in Dison, Luik (region)
- 1,500 EUR per month
- 25 EUR /m2/year
-
2606 m2 industrial property for rent in Olen, Antwerp (Province)
- 7,384 EUR per month
- 34 EUR /m2/year
-
123 m2 industrial property for rent in Seraing, Luik (region)
- 700 EUR per month
- 68.29 EUR /m2/year
-
350 m2 industrial property for rent in Seraing, Luik (region)
- 2,500 EUR per month
- 85.71 EUR /m2/year
-
75 m2 industrial property for rent in Bocholt, Limburg
- 42 EUR per month
- 6.67 EUR /m2/year
-
212 m2 office space for rent in Gent Drongen, Gent
- 1,236 EUR per month
- 69.96 EUR /m2/year
Frequently asked questions
Statistics on the development of available industrial properties for rent in Belgium over the past month
Also see aggregate statistics on all available industrial properties in Belgium over time, aggregate statistics on new industrial properties in Belgium over time, aggregate statistics on rented industrial properties in Belgium over time
| Date | |||
|---|---|---|---|
| 13. January 2026 | 154 | 1 | 5 |
| 12. January 2026 | 158 | 0 | 1 |
| 11. January 2026 | 159 | 4 | 3 |
| 10. January 2026 | 158 | 0 | 0 |
| 9. January 2026 | 158 | 10 | 6 |
| 8. January 2026 | 154 | 4 | 3 |
| 7. January 2026 | 153 | 3 | 0 |
| 6. January 2026 | 150 | 0 | 0 |
| 5. January 2026 | 150 | 0 | 0 |
| 4. January 2026 | 150 | 0 | 0 |
| 3. January 2026 | 150 | 0 | 0 |
| 2. January 2026 | 150 | 0 | 0 |
| 1. January 2026 | 150 | 0 | 0 |
| 31. December 2025 | 150 | 0 | 0 |
| 30. December 2025 | 150 | 0 | 0 |
| 29. December 2025 | 150 | 0 | 2 |
| 28. December 2025 | 152 | 0 | 0 |
| 27. December 2025 | 152 | 0 | 0 |
| 26. December 2025 | 152 | 6 | 6 |
| 25. December 2025 | 152 | 5 | 0 |
| 24. December 2025 | 147 | 12 | 12 |
| 23. December 2025 | 147 | 11 | 0 |
| 22. December 2025 | 136 | 1 | 98 |
| 21. December 2025 | 233 | 0 | 9 |
| 20. December 2025 | 242 | 0 | 0 |
| 19. December 2025 | 242 | 3 | 3 |
| 18. December 2025 | 242 | 1 | 0 |
| 17. December 2025 | 241 | 3 | 4 |
| 16. December 2025 | 242 | 6 | 0 |
| 15. December 2025 | 236 | 0 | 6 |
| 14. December 2025 | 242 | 1 | 0 |
Statistics on currently available industrial properties in Belgium
Also see gathered statistics of all available industrial properties over time, the gathered statistics of new industrial properties over time, the gathered statistics of rented industrial properties over time
| Industrial properties | |
|---|---|
| Available premises | 154 |
| New premises since yesterday | 1 |
| Rented out premises since yesterday | 5 |
| Total available m2 | 248,604 |
| Average price per m2 per year without expenses | 308 |
| Highest price per m2 per year | 4,080 |
| Lowest price per m2 per year | 2.67 |


