


Clinic for rentin Hull (Region)
These commercial premises are closest to your search
We currently have no available commercial premises registered that match your search exactly. Therefore, we show below the commercial premises that best match your search based on the current market.
The shown listings may differ from your original search in terms of, for example, premises type, location, size or price, but they have been selected because they may be relevant alternatives for your business.
Take a look at the suggestions below – or start your search again here.
Companyspace.com today:
New today 2,651
Updated 24h 2,651
Notifications about new companyspaces2,255
Copenhagen +140
Stockholm +8
Amsterdam +15
Berlin +1
Oslo +18
Brussels +71
Vienna +49
Paris +7
Madrid +1
Dublin (county) +4
Warsaw +8
Latest update 36 min ago
Active ads 369,475
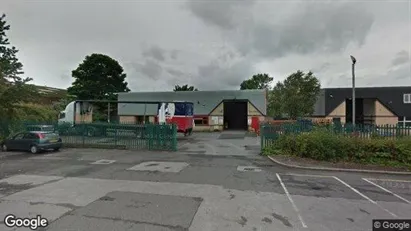
Industrial property in Hull - North Humberside, North East
 More info
Industrial property in Hull - North Humberside, North East
Production for rent in Hull - North Humberside, North East
Areal
Ca. 3,265 m2
Pris pr. md.
Ca. 22,000 GBP pr md
Område
Hull - North Humberside, North East
Type
Industrial property
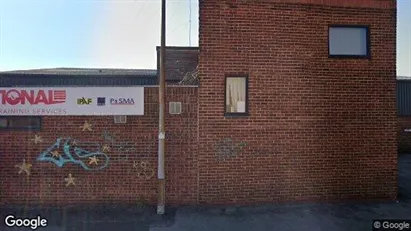
Industrial property in Hull - North Humberside, North East
 More info
Industrial property in Hull - North Humberside, North East
Production for rent in Hull - North Humberside, North East
Areal
Ca. 6,200 m2
Pris pr. md.
Ca. 42,000 GBP pr md
Område
Hull - North Humberside, North East
Type
Industrial property
Office space in Beverley - North Humberside, North East
 More info
Office space in Beverley - North Humberside, North East
Office space for rent in Beverley - North Humberside, North East
Areal
Ca. 660 m2
Pris pr. md.
Ca. 8,500 GBP pr md
Område
Beverley - North Humberside, North East
Type
Office space
Industrial property in Hull - North Humberside, North East
 More info
Industrial property in Hull - North Humberside, North East
Production for rent in Hull - North Humberside, North East
Areal
Ca. 3,865 m2
Pris pr. md.
Ca. 22,000 GBP pr md
Område
Hull - North Humberside, North East
Type
Industrial property
Office space in Hull - North Humberside, North East
 More info
Office space in Hull - North Humberside, North East
Office space for rent in Hull - North Humberside, North East
Areal
Ca. 1,075 m2
Pris pr. md.
Ca. 12,000 GBP pr md
Område
Hull - North Humberside, North East
Type
Office space
Shop in Hull - North Humberside, North East
More info
We monitor the market!
Shop in Hull - North Humberside, North East
Retail space for rent in Hull - North Humberside, North East
Areal
Ca. 1,450 m2
Pris pr. md.
Ca. 22,500 GBP pr md
Område
Hull - North Humberside, North East
Type
Shop
Commercial property in Hull - North Humberside, North East
More info
We monitor the market!
Commercial property in Hull - North Humberside, North East
Commercial property for sale in Hull - North Humberside, North East
Areal
Ca. 7,740 m2
Pris
Ca. 603,000EUR
Område
Hull - North Humberside, North East
Type
Commercial property
Office space in Hull - North Humberside, North East
More info
We monitor the market!
Office space in Hull - North Humberside, North East
Office space for rent in Hull - North Humberside, North East
Areal
Ca. 1,865 m2
Pris pr. md.
Ca. 21,500 GBP pr md
Område
Hull - North Humberside, North East
Type
Office space
Shop in Beverley - North Humberside, North East
More info
We monitor the market!
Shop in Beverley - North Humberside, North East
Retail space for rent in Beverley - North Humberside, North East
Areal
Ca. 1,450 m2
Pris pr. md.
Ca. 30,000 GBP pr md
Område
Beverley - North Humberside, North East
Type
Shop
Retail property in Hull - North Humberside, North East
More info
We monitor the market!
Retail property in Hull - North Humberside, North East
Retail space for sale in Hull - North Humberside, North East
Areal
Ca. 2,415 m2
Pris
Ca. 224,000EUR
Område
Hull - North Humberside, North East
Type
Shop
Real estate land in North Ferriby - North Humberside, North East
More info
We monitor the market!
Real estate land in North Ferriby - North Humberside, North East
Ground for commercial use for sale in North Ferriby - North Humberside, North East
Areal
Ca. 5 m2
Pris
Ca. 1,724,000EUR
Område
North Ferriby - North Humberside, North East
Type
Land
Industrial property in Hull - North Humberside, North East
More info
We monitor the market!
Industrial property in Hull - North Humberside, North East
Production for sale in Hull - North Humberside, North East
Areal
Ca. 6,015 m2
Pris
Ca. 540,000EUR
Område
Hull - North Humberside, North East
Type
Industrial property
Office property in Hull - North Humberside, North East
More info
We monitor the market!
Office property in Hull - North Humberside, North East
Office space for sale in Hull - North Humberside, North East
Areal
Ca. 1,195 m2
Pris
Ca. 155,000EUR
Område
Hull - North Humberside, North East
Type
Office space
Office property in Hull - North Humberside, North East
More info
We monitor the market!
Office property in Hull - North Humberside, North East
Office space for sale in Hull - North Humberside, North East
Areal
Ca. 1,510 m2
Pris
Ca. 259,000EUR
Område
Hull - North Humberside, North East
Type
Office space
Commercial property in Hull - North Humberside, North East
More info
We monitor the market!
Commercial property in Hull - North Humberside, North East
Commercial property for sale in Hull - North Humberside, North East
Areal
Ca. 5,960 m2
Pris
Ca. 747,000EUR
Område
Hull - North Humberside, North East
Type
Commercial property
Land in Brough - North Humberside, North East
More info
We monitor the market!
Land in Brough - North Humberside, North East
Ground for commercial use for rent in Brough - North Humberside, North East
Areal
Ca. 10 m2
Pris pr. md.
Ca. 30,000 GBP pr md
Område
Brough - North Humberside, North East
Type
Land
Office space in Hull - North Humberside, North East
More info
We monitor the market!
Office space in Hull - North Humberside, North East
Office space for rent in Hull - North Humberside, North East
Areal
Ca. 850 m2
Pris pr. md.
Ca. 8,250 GBP pr md
Område
Hull - North Humberside, North East
Type
Office space
Industrial property in Hull - North Humberside, North East
More info
We monitor the market!
Industrial property in Hull - North Humberside, North East
Production for rent in Hull - North Humberside, North East
Areal
Ca. 5,165 m2
Pris pr. md.
Ca. 38,700 GBP pr md
Område
Hull - North Humberside, North East
Type
Industrial property
Selected customers
30,000 customers use Companyspace.com
30,000 customers
285,000 companies in our database
2,400 rentals annually
Companyspace.com is used by thousands of landlords, property companies, commercial real estate agents, investors and business centres seeking greater visibility, more enquiries and lower vacancy rates.


