


Industrial properties in Vilhelmina
These commercial premises are closest to your search
We currently have no available commercial premises registered that match your search exactly. Therefore, we show below the commercial premises that best match your search based on the current market.
The shown listings may differ from your original search in terms of, for example, premises type, location, size or price, but they have been selected because they may be relevant alternatives for your business.
Take a look at the suggestions below – or start your search again here.
Companyspace.com today:
New today 856
Updated 24h 1,305
Notifications about new companyspaces153
Copenhagen +7
Stockholm +2
Amsterdam +27
Brussels +20
Vienna +33
Dublin (county) +15
Warsaw +9
Latest update 1 h ago
Active ads 365,652
Commercial space in Skellefteå, Västerbotten County
More info
Commercial space in Skellefteå, Västerbotten County
Commercial space for rent in Skellefteå, Västerbotten County
Areal
264 m2
Pris pr. md.
Not stated
Område
Skellefteå, Västerbotten County
Type
Commercial property
Office space in Skellefteå, Västerbotten County
More info
Office space in Skellefteå, Västerbotten County
Office space for rent in Skellefteå, Västerbotten County
Areal
40 m2
Pris pr. md.
Not stated
Område
Skellefteå, Västerbotten County
Type
Office space
Restaurant in Skellefteå, Västerbotten County
More info
Restaurant in Skellefteå, Västerbotten County
Restaurant for rent in Skellefteå, Västerbotten County
Areal
200 m2
Pris pr. md.
Not stated
Område
Skellefteå, Västerbotten County
Type
Restaurant
Warehouse in Umeå, Västerbotten County
 More info
Warehouse in Umeå, Västerbotten County
Warehouse for rent in Umeå, Västerbotten County
Areal
155 - 3,000 m2
Pris pr. md.
Ca. 10,850 SEK pr md
Område
Umeå, Västerbotten County
Type
Warehouse
Commercial space in Lycksele, Västerbotten County
 More info
Commercial space in Lycksele, Västerbotten County
Commercial space for rent in Lycksele, Västerbotten County
Areal
Ca. 75 m2
Pris pr. md.
Ca. 6,950 SEK pr md
Område
Lycksele, Västerbotten County
Type
Commercial property
Commercial space in Lycksele, Västerbotten County
More info
Commercial space in Lycksele, Västerbotten County
Commercial space for rent in Lycksele, Västerbotten County
Areal
Ca. 30 m2
Pris pr. md.
Ca. 2,900 SEK pr md
Område
Lycksele, Västerbotten County
Type
Commercial property
Commercial space in Lycksele, Västerbotten County
More info
Commercial space in Lycksele, Västerbotten County
Commercial space for rent in Lycksele, Västerbotten County
Areal
Ca. 35 m2
Pris pr. md.
Ca. 3,700 SEK pr md
Område
Lycksele, Västerbotten County
Type
Commercial property
Commercial space in Lycksele, Västerbotten County
More info
Commercial space in Lycksele, Västerbotten County
Commercial space for rent in Lycksele, Västerbotten County
Areal
Ca. 60 m2
Pris pr. md.
Ca. 5,400 SEK pr md
Område
Lycksele, Västerbotten County
Type
Commercial property
Commercial space in Umeå, Västerbotten County
More info
Commercial space in Umeå, Västerbotten County
Commercial space for rent in Umeå, Västerbotten County
Areal
Ca. 15 m2
Pris pr. md.
Ca. 2,650 SEK pr md
Område
Umeå, Västerbotten County
Type
Commercial property
Commercial space in Lycksele, Västerbotten County
 More info
Commercial space in Lycksele, Västerbotten County
Commercial space for rent in Lycksele, Västerbotten County
Areal
-
Pris pr. md.
Ca. 300 SEK pr md
Område
Lycksele, Västerbotten County
Type
Commercial property
Garage in Lycksele, Västerbotten County
 More info
Garage in Lycksele, Västerbotten County
Garage for rent in Lycksele, Västerbotten County
Areal
Ca. 15 m2
Pris pr. md.
Ca. 600 SEK pr md
Område
Lycksele, Västerbotten County
Type
Garage
Shop in Skellefteå, Västerbotten County
 More info
Shop in Skellefteå, Västerbotten County
Shop for rent in Skellefteå, Västerbotten County
Areal
100 - 200 m2
Pris pr. md.
Ca. 11,650 SEK pr md
Område
Skellefteå, Västerbotten County
Type
Shop
Industrial property in Vännäs, Västerbotten County
 More info
Industrial property in Vännäs, Västerbotten County
Industrial property for rent in Vännäs, Västerbotten County
Areal
Ca. 670 m2
Pris pr. md.
Ca. 25,650 SEK pr md
Område
Vännäs, Västerbotten County
Type
Industrial property
Industrial property in Umeå, Västerbotten County
 More info
Industrial property in Umeå, Västerbotten County
Industrial property for sale in Umeå, Västerbotten County
Areal
Ca. 500 m2
Pris
Not stated
Område
Umeå, Västerbotten County
Type
Industrial property
Shop in Skellefteå, Västerbotten County
 More info
Shop in Skellefteå, Västerbotten County
Shop for rent in Skellefteå, Västerbotten County
Areal
Ca. 200 m2
Pris pr. md.
Not stated
Område
Skellefteå, Västerbotten County
Type
Shop
Office space in Storuman, Västerbotten County
 More info
Office space in Storuman, Västerbotten County
Office space for rent in Storuman, Västerbotten County
Areal
Ca. 220 m2
Pris pr. md.
Not stated
Område
Storuman, Västerbotten County
Type
Office space
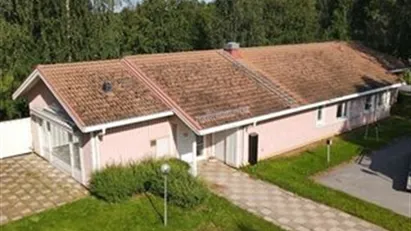
Commercial property in Umeå, Västerbotten County
 More info
Commercial property in Umeå, Västerbotten County
Commercial property for sale in Umeå, Västerbotten County
Areal
-
Pris
Not stated
Område
Umeå, Västerbotten County
Type
Commercial property
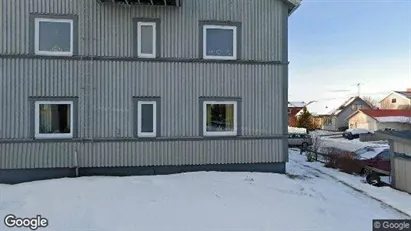
Commercial property in Umeå, Västerbotten County
 More info
Commercial property in Umeå, Västerbotten County
Commercial property for sale in Umeå, Västerbotten County
Areal
-
Pris
Not stated
Område
Umeå, Västerbotten County
Type
Commercial property
Selected customers
Selected customers
30,000 customers use Companyspace.com
30,000 customers
285,000 companies in our database
2,400 rentals annually
Companyspace.com is used by thousands of landlords, property companies, commercial real estate agents, investors and business centres seeking greater visibility, more enquiries and lower vacancy rates.


