


Industrial properties in Norrtälje
Companyspace.com today:
Updated 24h 510
Notifications about new companyspaces20
Latest update 6 min ago
Active ads 365,613
16 industrial properties found
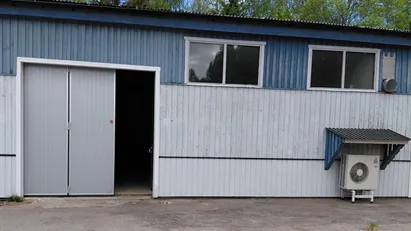
Industrial property in Norrtälje, Stockholm County
 More info
Industrial property in Norrtälje, Stockholm County
Industrial property for rent in Norrtälje, Stockholm County
Areal
Ca. 140 m2
Pris pr. md.
Ca. 5,000 SEK per month
Område
Norrtälje, Stockholm County
Type
Industrial property
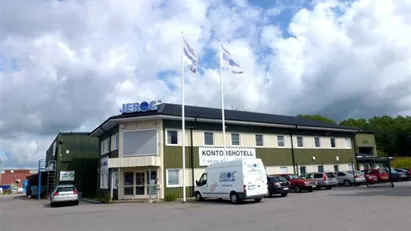
Industrial property in Norrtälje, Stockholm County
 More info
Industrial property in Norrtälje, Stockholm County
Industrial property for rent in Norrtälje, Stockholm County
Areal
Ca. 895 m2
Pris pr. md.
Not stated
Område
Norrtälje, Stockholm County
Type
Industrial property
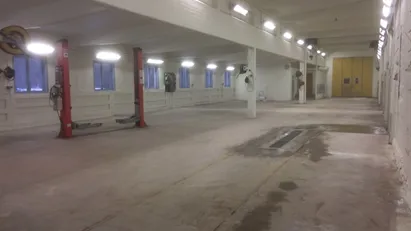
Industrial property in Norrtälje, Stockholm County
 More info
Industrial property in Norrtälje, Stockholm County
Industrial property for rent in Norrtälje, Stockholm County
Areal
Ca. 580 m2
Pris pr. md.
Ca. 22,000 SEK per month
Område
Norrtälje, Stockholm County
Type
Industrial property
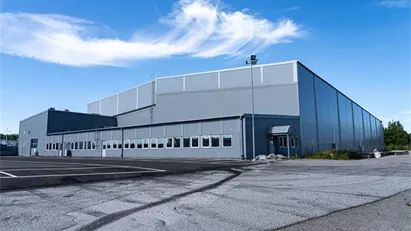
Industrial property in Norrtälje, Stockholm County
 More info
Industrial property in Norrtälje, Stockholm County
Industrial property for rent in Norrtälje, Stockholm County
Areal
Ca. 200 m2
Pris pr. md.
Ca. 1,200 SEK per month
Område
Norrtälje, Stockholm County
Type
Industrial property
Warehouse in Norrtälje, Stockholm County
 More info
Warehouse in Norrtälje, Stockholm County
Warehouse for rent in Norrtälje, Stockholm County
Areal
1,000 - 5,746 m2
Pris pr. md.
Not stated
Område
Norrtälje, Stockholm County
Type
Warehouse
Industrial property in Norrtälje, Stockholm County
 More info
Industrial property in Norrtälje, Stockholm County
Industrial property for sale in Norrtälje, Stockholm County
Areal
-
Pris
Not stated
Område
Norrtälje, Stockholm County
Type
Industrial property
Industrial property in Norrtälje, Stockholm County
 More info
Industrial property in Norrtälje, Stockholm County
Industrial property for rent in Norrtälje, Stockholm County
Areal
Ca. 1,000 m2
Pris pr. md.
Not stated
Område
Norrtälje, Stockholm County
Type
Industrial property
Industrial property in Norrtälje, Stockholm County
 More info
Industrial property in Norrtälje, Stockholm County
Industrial property for rent in Norrtälje, Stockholm County
Areal
Ca. 1,000 m2
Pris pr. md.
Not stated
Område
Norrtälje, Stockholm County
Type
Industrial property
Industrial property in Norrtälje, Stockholm County
 More info
Industrial property in Norrtälje, Stockholm County
Industrial property for rent in Norrtälje, Stockholm County
Areal
1,000 - 5,746 m2
Pris pr. md.
Not stated
Område
Norrtälje, Stockholm County
Type
Industrial property
Industrial property in Norrtälje, Stockholm County
More info
Industrial property in Norrtälje, Stockholm County
Industrial property for rent in Norrtälje, Stockholm County
Areal
-
Pris pr. md.
Not stated
Område
Norrtälje, Stockholm County
Type
Industrial property
Industrial property in Norrtälje, Stockholm County
More info
Industrial property in Norrtälje, Stockholm County
Industrial property for rent in Norrtälje, Stockholm County
Areal
Ca. 1,000 m2
Pris pr. md.
Not stated
Område
Norrtälje, Stockholm County
Type
Industrial property
Industrial property in Norrtälje, Stockholm County
More info
Industrial property in Norrtälje, Stockholm County
Industrial property for rent in Norrtälje, Stockholm County
Areal
Ca. 1,000 m2
Pris pr. md.
Not stated
Område
Norrtälje, Stockholm County
Type
Industrial property
Industrial property in Norrtälje, Stockholm County
More info
Industrial property in Norrtälje, Stockholm County
Industrial property for rent in Norrtälje, Stockholm County
Areal
Ca. 1,200 m2
Pris pr. md.
Not stated
Område
Norrtälje, Stockholm County
Type
Industrial property
Industrial property in Norrtälje, Stockholm County
More info
Industrial property in Norrtälje, Stockholm County
Industrial property for rent in Norrtälje, Stockholm County
Areal
Ca. 2,000 m2
Pris pr. md.
Not stated
Område
Norrtälje, Stockholm County
Type
Industrial property
Industrial property in Norrtälje, Stockholm County
More info
Industrial property in Norrtälje, Stockholm County
Industrial property for rent in Norrtälje, Stockholm County
Areal
1,000 - 5,746 m2
Pris pr. md.
Not stated
Område
Norrtälje, Stockholm County
Type
Industrial property
Industrial property in Norrtälje, Stockholm County
More info
Industrial property in Norrtälje, Stockholm County
Industrial property for rent in Norrtälje, Stockholm County
Areal
Ca. 28,000 m2
Pris pr. md.
Not stated
Område
Norrtälje, Stockholm County
Type
Industrial property
Selected customers
Selected customers
30,000 customers use Companyspace.com
30,000 customers
285,000 companies in our database
2,400 rentals annually
Companyspace.com is used by thousands of landlords, property companies, commercial real estate agents, investors and business centres seeking greater visibility, more enquiries and lower vacancy rates.


