Available clinics in Sweden
See all available clinics in Sweden below. If you are looking for clinic in Sweden, you have come to the right place. We have most available clinics in Sweden in our database. Find clinic in Sweden here. Enjoy.
Gothenburg
Malmö
Stockholm
Blekinge County
Dalarna
Gotland (region)
Gävleborg County
Halland County
Jämtland County
Jönköping County
Kalmar County
Kronoberg County
Norrbotten County
Skåne County
Stockholm County
Södermanland County
Uppsala County
Värmland County
Västerbotten County
Västernorrland County
Västmanland County
Västra Götaland County
Örebro County
Östergötland County
107 clinics found
-
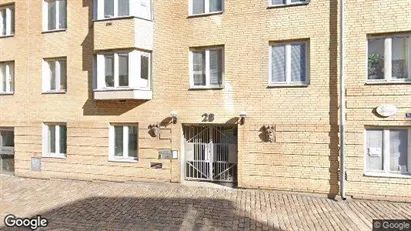
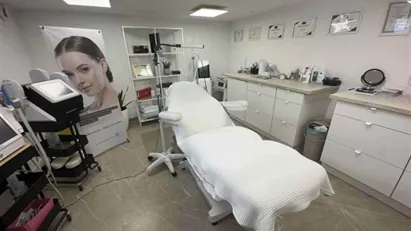
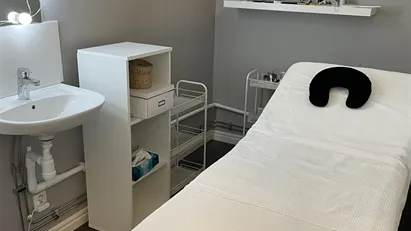
9 m2 clinic for rent in Majorna-Linné, Gothenburg
- 600 EUR per month
- 800 EUR /m2/year
-
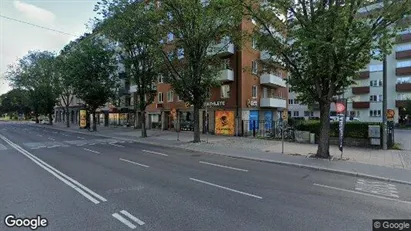
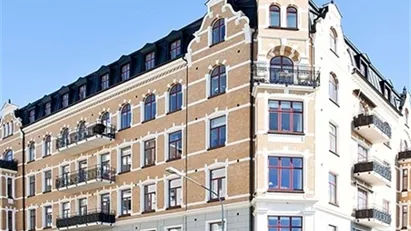
6 - 16 m2 clinic for rent in Östermalm, Stockholm
- Ca. 3,150 SEK /m2/year
-
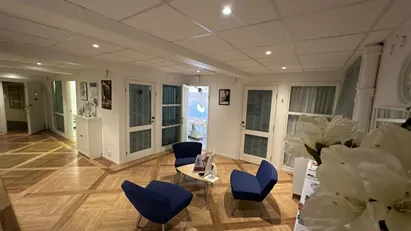
65 m2 clinic for rent in Helsingborg, Skåne County
- Ca. 6,000 SEK per month
- Ca. 1,100 SEK /m2/year
-
70 m2 office space for rent in Helsingborg, Skåne County
- Ca. 11,900 SEK per month
- Ca. 2,050 SEK /m2/year
-
10 m2 clinic for rent in Karlstad, Värmland County
- Ca. 250 SEK per month
- Ca. 300 SEK /m2/year
-
20 m2 clinic for rent in Kungsholmen, Stockholm
- Ca. 20,000 SEK per month
- Ca. 12,000 SEK /m2/year
-
67 m2 office space for rent in Sundbyberg, Stockholm County
- Ca. 16,650 SEK per month
- Ca. 3,000 SEK /m2/year
-
11 m2 clinic for rent in Vasastan, Stockholm
- Ca. 4,550 SEK /m2/year
-
250 m2 shop for rent in Köping, Västmanland County
- Ca. 15,000 SEK per month
- Ca. 700 SEK /m2/year
-
50 m2 clinic for rent in Botkyrka, Stockholm County
- Ca. 7,200 SEK per month
- Ca. 1,750 SEK /m2/year
-
10 m2 clinic for rent in Nacka, Stockholm County
- Ca. 9,600 SEK /m2/year
-
15 m2 clinic for rent in Karlstad, Värmland County
- Ca. 4,000 SEK per month
- Ca. 3,200 SEK /m2/year
-
10 m2 clinic for rent in Vasastan, Stockholm
- Ca. 10,000 SEK per month
- Ca. 50 SEK /m2/year
-
130 m2 shop for rent in Gävle, Gävleborg County
- Ca. 20,000 SEK per month
- Ca. 1,850 SEK /m2/year
Frequently asked questions
Statistics on the development of available clinics for rent in Sweden over the past month
Also see aggregate statistics on all available clinics in Sweden over time, aggregate statistics on new clinics in Sweden over time, aggregate statistics on rented clinics in Sweden over time
| Date | |||
|---|---|---|---|
| 21. January 2026 | 101 | 0 | 1 |
| 20. January 2026 | 102 | 0 | 0 |
| 19. January 2026 | 102 | 0 | 0 |
| 18. January 2026 | 102 | 0 | 0 |
| 17. January 2026 | 102 | 2 | 2 |
| 16. January 2026 | 102 | 3 | 2 |
| 15. January 2026 | 101 | 3 | 0 |
| 14. January 2026 | 98 | 0 | 0 |
| 13. January 2026 | 98 | 1 | 2 |
| 12. January 2026 | 99 | 0 | 0 |
| 11. January 2026 | 99 | 0 | 0 |
| 10. January 2026 | 99 | 0 | 0 |
| 9. January 2026 | 99 | 0 | 0 |
| 8. January 2026 | 99 | 0 | 0 |
| 7. January 2026 | 99 | 1 | 2 |
| 6. January 2026 | 100 | 1 | 0 |
| 5. January 2026 | 99 | 0 | 0 |
| 4. January 2026 | 99 | 0 | 0 |
| 3. January 2026 | 99 | 1 | 1 |
| 2. January 2026 | 99 | 1 | 0 |
| 1. January 2026 | 98 | 1 | 0 |
| 31. December 2025 | 97 | 0 | 0 |
| 30. December 2025 | 97 | 0 | 0 |
| 29. December 2025 | 97 | 0 | 0 |
| 28. December 2025 | 97 | 1 | 1 |
| 27. December 2025 | 97 | 1 | 0 |
| 26. December 2025 | 96 | 0 | 0 |
| 25. December 2025 | 96 | 1 | 1 |
| 24. December 2025 | 96 | 1 | 0 |
| 23. December 2025 | 95 | 1 | 0 |
| 22. December 2025 | 94 | 0 | 0 |
Statistics on currently available clinics in Sweden
Also see gathered statistics of all available clinics over time, the gathered statistics of new clinics over time, the gathered statistics of rented clinics over time
| Clinics | |
|---|---|
| Available premises | 102 |
| New premises since yesterday | 0 |
| Rented out premises since yesterday | 1 |
| Total available m2 | 21,304 |
| Average price per m2 per year without expenses | 271 |
| Highest price per m2 per year | 1,137 |
| Lowest price per m2 per year | 1 |


