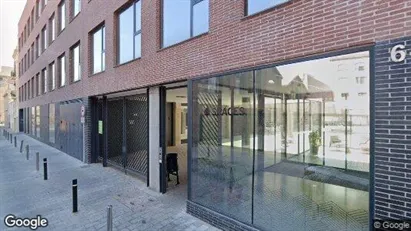
Available office spaces in Cataluña
See all available office spaces in Cataluña below. If you are looking for office space in Cataluña, you have come to the right place. We have most available office spaces in Cataluña in our database. Find office space in Cataluña here. Enjoy.
1,200 office spaces found
-
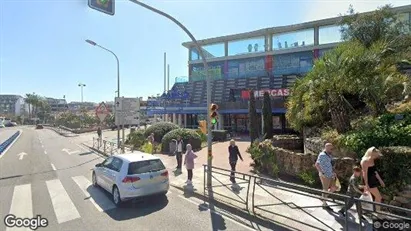
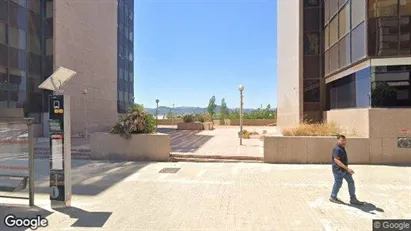
Ca. 4,155 m2 office space for rent in Esplugues de Llobregat, Cataluña
- Ca. 66,450 EUR per month
- Ca. 200 EUR /m2/year
-
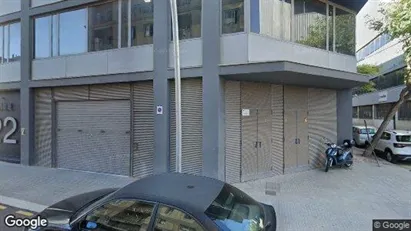
Ca. 715 m2 office space for rent in Sant Just Desvern, Cataluña
- Ca. 6,450 EUR per month
- Ca. 100 EUR /m2/year
-
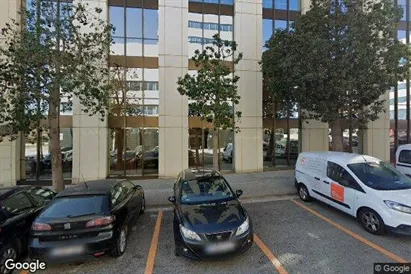
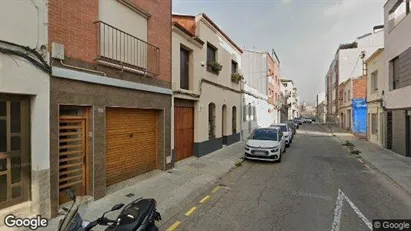
Ca. 2,995 m2 office space for rent in Viladecans, Cataluña
- Ca. 35,950 EUR per month
- Ca. 150 EUR /m2/year
-
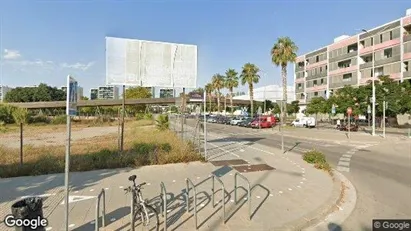
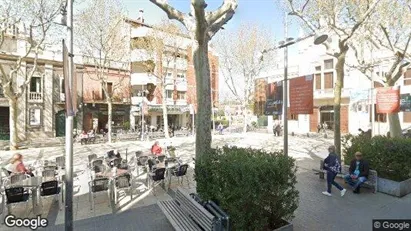
Ca. 1,440 m2 office space for rent in Sant Joan Despí, Cataluña
- Ca. 9,650 EUR per month
- Ca. 100 EUR /m2/year
-
Ca. 50 m2 office space for rent in Terrassa, Cataluña
- Ca. 450 EUR per month
- Ca. 100 EUR /m2/year
-
Ca. 85 m2 office space for rent in Terrassa, Cataluña
- Ca. 1,000 EUR per month
- Ca. 150 EUR /m2/year
-
Ca. 100 m2 office space for rent in Terrassa, Cataluña
- Ca. 1,200 EUR per month
- Ca. 150 EUR /m2/year
-
Ca. 300 m2 office space for rent in Terrassa, Cataluña
- Ca. 1,200 EUR per month
- Ca. 50 EUR /m2/year
-
Ca. 2,530 m2 office space for rent in El Prat de Llobregat, Cataluña
- Ca. 24,050 EUR per month
- Ca. 100 EUR /m2/year
-
Ca. 275 m2 office space for rent in El Prat de Llobregat, Cataluña
- Ca. 3,000 EUR per month
- Ca. 150 EUR /m2/year
-
Ca. 760 m2 office space for rent in L'Hospitalet de Llobregat, Cataluña
- Ca. 12,900 EUR per month
- Ca. 200 EUR /m2/year
-
Ca. 1,450 m2 office space for rent in Esplugues de Llobregat, Cataluña
- Ca. 23,200 EUR per month
- Ca. 200 EUR /m2/year
-
Ca. 955 m2 office space for rent in Esplugues de Llobregat, Cataluña
- Ca. 15,300 EUR per month
- Ca. 200 EUR /m2/year
-
Ca. 5 m2 office space for rent in Sant Cugat del Vallès, Cataluña
- Ca. 150 EUR per month
- Ca. 2,000 EUR /m2/year
-
Ca. 5 m2 office space for rent in Barcelona Ciutat Vella, Barcelona
- Ca. 300 EUR per month
- Ca. 3,450 EUR /m2/year
-
Ca. 5 m2 office space for rent in Barcelona Sant Martí, Barcelona
- Ca. 200 EUR per month
- Ca. 2,650 EUR /m2/year
-
Ca. 5 m2 office space for rent in Barcelona Sant Martí, Barcelona
- Ca. 150 EUR per month
- Ca. 1,900 EUR /m2/year
Frequently asked questions
Statistics on the development of available office spaces for rent in Cataluña over the past month
Also see aggregate statistics on all available office spaces in Cataluña over time, aggregate statistics on new office spaces in Cataluña over time, aggregate statistics on rented office spaces in Cataluña over time
| Date | |||
|---|---|---|---|
| 1. February 2026 | 1200 | 0 | 1 |
| 31. January 2026 | 1201 | 14 | 14 |
| 30. January 2026 | 1201 | 6 | 3 |
| 29. January 2026 | 1198 | 7 | 0 |
| 28. January 2026 | 1191 | 2 | 3 |
| 27. January 2026 | 1192 | 9 | 9 |
| 26. January 2026 | 1192 | 5 | 0 |
| 25. January 2026 | 1187 | 6 | 8 |
| 24. January 2026 | 1189 | 4 | 0 |
| 23. January 2026 | 1185 | 6 | 10 |
| 22. January 2026 | 1189 | 13 | 17 |
| 21. January 2026 | 1193 | 6 | 0 |
| 20. January 2026 | 1187 | 5 | 4 |
| 19. January 2026 | 1186 | 1 | 1 |
| 18. January 2026 | 1186 | 2 | 1 |
| 17. January 2026 | 1185 | 1 | 5 |
| 16. January 2026 | 1189 | 4 | 0 |
| 15. January 2026 | 1185 | 1 | 10 |
| 14. January 2026 | 1194 | 4 | 2 |
| 13. January 2026 | 1192 | 3 | 8 |
| 12. January 2026 | 1197 | 7 | 10 |
| 11. January 2026 | 1200 | 5 | 0 |
| 10. January 2026 | 1195 | 3 | 5 |
| 9. January 2026 | 1197 | 3 | 5 |
| 8. January 2026 | 1199 | 172 | 175 |
| 7. January 2026 | 1202 | 171 | 0 |
| 6. January 2026 | 1031 | 3 | 2 |
| 5. January 2026 | 1030 | 3 | 0 |
| 4. January 2026 | 1027 | 1 | 0 |
| 3. January 2026 | 1026 | 3 | 3 |
| 2. January 2026 | 1026 | 1 | 0 |
Statistics on currently available office spaces in Cataluña in Spain
Also see gathered statistics of all available office spaces in Cataluña over time, the gathered statistics of new office spaces in Cataluña over time, the gathered statistics of rented office spaces in Cataluña over time
| Office spaces | |
|---|---|
| Available premises | 1,200 |
| New premises since yesterday | 0 |
| Rented out premises since yesterday | 1 |
| Total available m2 | 1,251,277 |
| Average price per m2 per year without expenses | 14,245 |
| Highest price per m2 per year | 996,000 |
| Lowest price per m2 per year | 1 |


