


Commercial premises in Europe
Companyspace.com today:
New today 31
Updated 24h 111
Copenhagen +2
Stockholm +1
Vienna +6
Latest update 6 min ago
Active ads 366,120
366,122 company spaces found
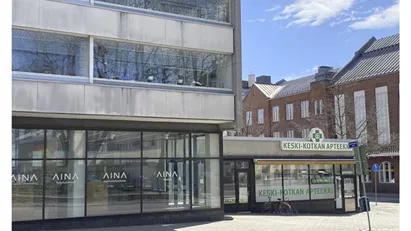
Office space in Kotka, Kymenlaakso
 More info
Office space in Kotka, Kymenlaakso
210m2 over 2 floors - main floor with high ceiling and big window
Areal
Ca. 210 m2
Pris pr. md.
Not stated
Område
Kotka, Kymenlaakso
Type
Office space
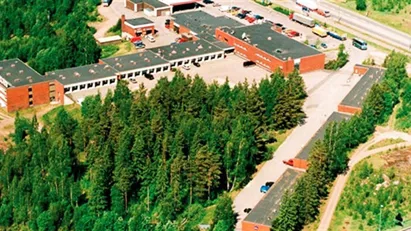
Commercial space in Kotka, Kymenlaakso
 More info
Commercial space in Kotka, Kymenlaakso
Hotel complex "Leikari", located in Finland, near the cities of Kotka and Hamina . 6 residential buildings (3 rivitalo, 3 adjacent two-storey buildings) with...
Areal
Ca. 100 m2
Pris pr. md.
Not stated
Område
Kotka, Kymenlaakso
Type
Commercial property
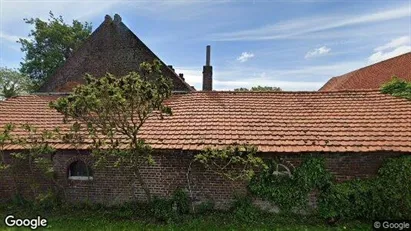
Commercial space in Ejby, Funen
 More info
Commercial space in Ejby, Funen
Commercial space for rent in Ejby, Funen
Areal
Ca. 650 m2
Pris pr. md.
Not stated
Område
Ejby, Funen
Type
Commercial property
Commercial space in Fredericia, Region of Southern Denmark
More info
Commercial space in Fredericia, Region of Southern Denmark
Commercial space for rent in Fredericia, Region of Southern Denmark
Areal
-
Pris pr. md.
Not stated
Område
Fredericia, Region of Southern Denmark
Type
Commercial property
Commercial space in Middelfart, Funen
More info
Commercial space in Middelfart, Funen
Commercial space for rent in Middelfart, Funen
Areal
Ca. 415 m2
Pris pr. md.
Not stated
Område
Middelfart, Funen
Type
Commercial property
Commercial space in Middelfart, Funen
More info
Commercial space in Middelfart, Funen
Commercial space for rent in Middelfart, Funen
Areal
Ca. 3,175 m2
Pris pr. md.
Not stated
Område
Middelfart, Funen
Type
Commercial property
Commercial space in Malmö City, Malmö
 More info
Commercial space in Malmö City, Malmö
Commercial space for rent in Malmö City, Malmö
Areal
Ca. 25 m2
Pris pr. md.
Not stated
Område
Malmö City, Malmö
Type
Commercial property
Commercial space in Stockholm West, Stockholm
 More info
Commercial space in Stockholm West, Stockholm
Commercial space for rent in Stockholm West, Stockholm
Areal
Ca. 30 m2
Pris pr. md.
Not stated
Område
Stockholm West, Stockholm
Type
Commercial property
Commercial space in Malmö City, Malmö
 More info
Commercial space in Malmö City, Malmö
Commercial space for rent in Malmö City, Malmö
Areal
Ca. 25 m2
Pris pr. md.
Not stated
Område
Malmö City, Malmö
Type
Commercial property
Commercial space in Malmö City, Malmö
 More info
Commercial space in Malmö City, Malmö
Commercial space for rent in Malmö City, Malmö
Areal
Ca. 15 m2
Pris pr. md.
Not stated
Område
Malmö City, Malmö
Type
Commercial property
Clinic in Leudal, Limburg
 More info
Clinic in Leudal, Limburg
Prachtige yurt te huur voor zingevende en coachende activiteiten. Omringd door natuur.
Areal
Ca. 35 m2
Pris pr. md.
Not stated
Område
Leudal, Limburg
Type
Clinic
Industrial property in Carrickmacross, Monaghan (region)
 More info
Industrial property in Carrickmacross, Monaghan (region)
Modern 8,432sq ft Warehouse/Agricultural Store available for lease.
Internally, 124ft long and 68ft feet wide. The roof height is 18ft to the eves and 25...
Areal
Ca. 785 m2
Pris pr. md.
Not stated
Område
Carrickmacross, Monaghan (region)
Type
Industrial property
Retail property in Copenhagen S, Copenhagen
 More info
Retail property in Copenhagen S, Copenhagen
Shop for sale in Copenhagen S, Copenhagen
Areal
Ca. 140 m2
Pris
N/A
Område
Copenhagen S, Copenhagen
Type
Shop
Retail property in Copenhagen S, Copenhagen
More info
Retail property in Copenhagen S, Copenhagen
Shop for sale in Copenhagen S, Copenhagen
Areal
Ca. 170 m2
Pris
N/A
Område
Copenhagen S, Copenhagen
Type
Shop
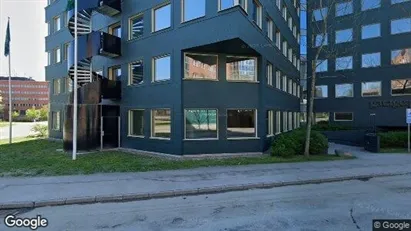
Office space in Stockholm West, Stockholm
 More info
Office space in Stockholm West, Stockholm
Office space for rent in Stockholm West, Stockholm
Areal
Ca. 750 m2
Pris pr. md.
Not stated
Område
Stockholm West, Stockholm
Type
Office space
Office space in Stockholm West, Stockholm
 More info
Office space in Stockholm West, Stockholm
Office space for rent in Stockholm West, Stockholm
Areal
Ca. 455 m2
Pris pr. md.
Not stated
Område
Stockholm West, Stockholm
Type
Office space
Office space in Stockholm West, Stockholm
 More info
Office space in Stockholm West, Stockholm
Office space for rent in Stockholm West, Stockholm
Areal
Ca. 30 m2
Pris pr. md.
Not stated
Område
Stockholm West, Stockholm
Type
Office space
Office space in Stockholm West, Stockholm
 More info
Office space in Stockholm West, Stockholm
Office space for rent in Stockholm West, Stockholm
Areal
Ca. 10 m2
Pris pr. md.
Not stated
Område
Stockholm West, Stockholm
Type
Office space
Selected customers
30,000 customers use Companyspace.com
30,000 customers
285,000 companies in our database
2,400 rentals annually
Companyspace.com is used by thousands of landlords, property companies, commercial real estate agents, investors and business centres seeking greater visibility, more enquiries and lower vacancy rates.


