


Industrial property for rent in Cazasu
These commercial premises are closest to your search
We currently have no available commercial premises registered that match your search exactly. Therefore, we show below the commercial premises that best match your search based on the current market.
The shown listings may differ from your original search in terms of, for example, premises type, location, size or price, but they have been selected because they may be relevant alternatives for your business.
Take a look at the suggestions below – or start your search again here.
Companyspace.com today:
New today 874
Updated 24h 3,160
Notifications about new companyspaces6,715
Copenhagen +1
Stockholm +1
Berlin +115
Vienna +12
Roma (region) +1
Greater London +1
Latest update 1 h ago
Active ads 365,868
Industrial property in Mangalia, Sud-Est
 More info
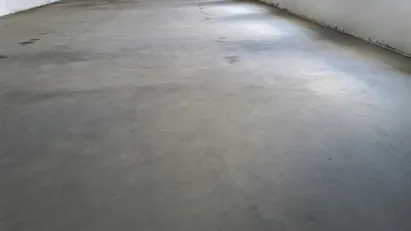
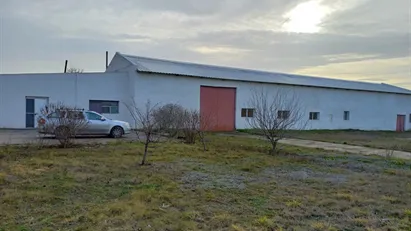
Industrial property in Mangalia, Sud-Est
3 warehouse total 1500 sqm, renovated, yard and cement platform 15000 sqm, utilities full
Areal
Ca. 15,500 m2
Pris pr. md.
Ca. 2,900 EUR pr md
Område
Mangalia, Sud-Est
Type
Industrial property
Warehouse in Mangalia, Sud-Est
 More info
Warehouse in Mangalia, Sud-Est
Warehouse for rent or sale Constanta, Mangalia
For rent or sale yard with 3 halls and direct entrance from DJ391.
The whole yard 1500 Euro + 16%, long ...
Areal
Ca. 1,500 m2
Pris pr. md.
Ca. 3,000 EUR pr md
Område
Mangalia, Sud-Est
Type
Warehouse
Office property in Adjud, Sud-Est
 More info
Office property in Adjud, Sud-Est
Office space for sale in Adjud, Sud-Est
Areal
-
Pris
Ca. 350,000EUR
Område
Adjud, Sud-Est
Type
Office space
Commercial property in Vânători, Sud-Est
 More info
Commercial property in Vânători, Sud-Est
Commercial property for sale in Vânători, Sud-Est
Areal
-
Pris
Ca. 950,000EUR
Område
Vânători, Sud-Est
Type
Commercial property
Commercial space in Focşani, Sud-Est
More info
Commercial space in Focşani, Sud-Est
Commercial space for rent in Focşani, Sud-Est
Areal
Ca. 60 m2
Pris pr. md.
Ca. 1,000 RON pr md
Område
Focşani, Sud-Est
Type
Commercial property
Commercial space in Mangalia, Sud-Est
More info
Commercial space in Mangalia, Sud-Est
Commercial space for rent in Mangalia, Sud-Est
Areal
Ca. 70 m2
Pris pr. md.
Ca. 700 EUR pr md
Område
Mangalia, Sud-Est
Type
Commercial property
Commercial space in Constanţa, Sud-Est
More info
Commercial space in Constanţa, Sud-Est
Commercial space for rent in Constanţa, Sud-Est
Areal
Ca. 120 m2
Pris pr. md.
Ca. 2,000 EUR pr md
Område
Constanţa, Sud-Est
Type
Commercial property
Office space in Constanţa, Sud-Est
 More info
Office space in Constanţa, Sud-Est
Office space for rent in Constanţa, Sud-Est
Areal
-
Pris pr. md.
Ca. 18,000 EUR pr md
Område
Constanţa, Sud-Est
Type
Office space
Commercial space in Focşani, Sud-Est
More info
Commercial space in Focşani, Sud-Est
Commercial space for rent in Focşani, Sud-Est
Areal
Ca. 100 m2
Pris pr. md.
Ca. 800 RON pr md
Område
Focşani, Sud-Est
Type
Commercial property
Office space in Buzău, Sud-Est
More info
Office space in Buzău, Sud-Est
Office space for rent in Buzău, Sud-Est
Areal
-
Pris pr. md.
Ca. 200 EUR pr md
Område
Buzău, Sud-Est
Type
Office space
Office space in Constanţa, Sud-Est
More info
Office space in Constanţa, Sud-Est
Office space for rent in Constanţa, Sud-Est
Areal
-
Pris pr. md.
Ca. 3,500 EUR pr md
Område
Constanţa, Sud-Est
Type
Office space
Commercial space in Focşani, Sud-Est
More info
Commercial space in Focşani, Sud-Est
Commercial space for rent in Focşani, Sud-Est
Areal
Ca. 225 m2
Pris pr. md.
Ca. 2,450 RON pr md
Område
Focşani, Sud-Est
Type
Commercial property
Commercial space in Constanţa, Sud-Est
More info
Commercial space in Constanţa, Sud-Est
Commercial space for rent in Constanţa, Sud-Est
Areal
Ca. 135 m2
Pris pr. md.
Ca. 1,000 EUR pr md
Område
Constanţa, Sud-Est
Type
Commercial property
Commercial space in Focşani, Sud-Est
More info
Commercial space in Focşani, Sud-Est
Commercial space for rent in Focşani, Sud-Est
Areal
Ca. 15 m2
Pris pr. md.
Ca. 300 RON pr md
Område
Focşani, Sud-Est
Type
Commercial property
Commercial space in Constanţa, Sud-Est
More info
Commercial space in Constanţa, Sud-Est
Commercial space for rent in Constanţa, Sud-Est
Areal
Ca. 135 m2
Pris pr. md.
Ca. 1,200 EUR pr md
Område
Constanţa, Sud-Est
Type
Commercial property
Commercial space in Constanţa, Sud-Est
More info
Commercial space in Constanţa, Sud-Est
Commercial space for rent in Constanţa, Sud-Est
Areal
Ca. 400 m2
Pris pr. md.
Ca. 470,000 RON pr md
Område
Constanţa, Sud-Est
Type
Commercial property
Commercial space in Focşani, Sud-Est
More info
Commercial space in Focşani, Sud-Est
Commercial space for rent in Focşani, Sud-Est
Areal
Ca. 15 m2
Pris pr. md.
Ca. 350 RON pr md
Område
Focşani, Sud-Est
Type
Commercial property
Commercial space in Năvodari, Sud-Est
More info
Commercial space in Năvodari, Sud-Est
Commercial space for rent in Năvodari, Sud-Est
Areal
Ca. 520 m2
Pris pr. md.
Ca. 9,000 EUR pr md
Område
Năvodari, Sud-Est
Type
Commercial property
Selected customers
30,000 customers use Companyspace.com
30,000 customers
285,000 companies in our database
2,400 rentals annually
Companyspace.com is used by thousands of landlords, property companies, commercial real estate agents, investors and business centres seeking greater visibility, more enquiries and lower vacancy rates.


