


Industrial properties in Năvodari
These commercial premises are closest to your search
We currently have no available commercial premises registered that match your search exactly. Therefore, we show below the commercial premises that best match your search based on the current market.
The shown listings may differ from your original search in terms of, for example, premises type, location, size or price, but they have been selected because they may be relevant alternatives for your business.
Take a look at the suggestions below – or start your search again here.
Companyspace.com today:
New today 1,800
Updated 24h 1,800
Notifications about new companyspaces2,199
Copenhagen +12
Stockholm +6
Amsterdam +3
Berlin +2
Brussels +11
Vienna +60
Paris +6
Madrid +2
Dublin (county) +19
Warsaw +8
Roma (region) +2
Lisbon +1
Latest update 9 min ago
Active ads 365,098
Industrial property in Mangalia, Sud-Est
 More info
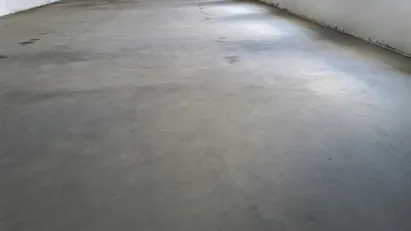
Industrial property in Mangalia, Sud-Est
3 warehouse total 1500 sqm, renovated, yard and cement platform 15000 sqm, utilities full
Areal
Ca. 15,500 m2
Pris pr. md.
Ca. 2,900 EUR per month
Område
Mangalia, Sud-Est
Type
Industrial property
Warehouse in Mangalia, Sud-Est
 More info
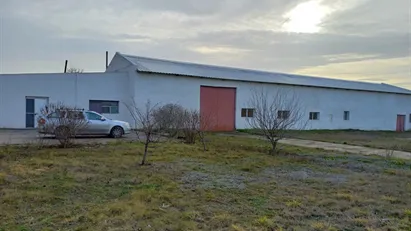
Warehouse in Mangalia, Sud-Est
Warehouse for rent or sale Constanta, Mangalia
For rent or sale yard with 3 halls and direct entrance from DJ391.
The whole yard 1500 Euro + 16%, long ...
Areal
Ca. 1,500 m2
Pris pr. md.
Ca. 3,000 EUR per month
Område
Mangalia, Sud-Est
Type
Warehouse
Office property in Focşani, Sud-Est
 More info
Office property in Focşani, Sud-Est
Office space for sale in Focşani, Sud-Est
Areal
-
Pris
Ca. 1,500,000EUR
Område
Focşani, Sud-Est
Type
Office space
Industrial property in Focşani, Sud-Est
 More info
Industrial property in Focşani, Sud-Est
Industrial property for sale in Focşani, Sud-Est
Areal
-
Pris
Ca. 379,000EUR
Område
Focşani, Sud-Est
Type
Industrial property
Office property in Focşani, Sud-Est
 More info
Office property in Focşani, Sud-Est
Office space for sale in Focşani, Sud-Est
Areal
-
Pris
Ca. 110,000EUR
Område
Focşani, Sud-Est
Type
Office space
Commercial space in Agigea, Sud-Est
 More info
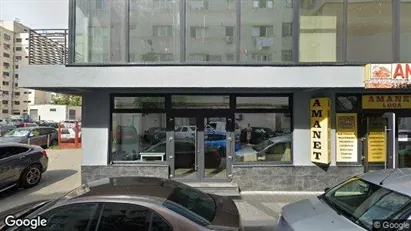
Commercial space in Agigea, Sud-Est
Commercial space for rent in Agigea, Sud-Est
Areal
Ca. 85 m2
Pris pr. md.
Ca. 600 EUR per month
Område
Agigea, Sud-Est
Type
Commercial property
Industrial property in Gugeşti, Sud-Est
 More info
Industrial property in Gugeşti, Sud-Est
Industrial property for sale in Gugeşti, Sud-Est
Areal
-
Pris
Ca. 135,000EUR
Område
Gugeşti, Sud-Est
Type
Industrial property
Office space in Constanţa, Sud-Est
 More info
Office space in Constanţa, Sud-Est
Office space for rent in Constanţa, Sud-Est
Areal
-
Pris pr. md.
Ca. 18,000 EUR per month
Område
Constanţa, Sud-Est
Type
Office space
Office space in Buzău, Sud-Est
More info
Office space in Buzău, Sud-Est
Office space for rent in Buzău, Sud-Est
Areal
-
Pris pr. md.
Ca. 200 EUR per month
Område
Buzău, Sud-Est
Type
Office space
Office space in Constanţa, Sud-Est
More info
Office space in Constanţa, Sud-Est
Office space for rent in Constanţa, Sud-Est
Areal
-
Pris pr. md.
Ca. 3,500 EUR per month
Område
Constanţa, Sud-Est
Type
Office space
Commercial space in Năvodari, Sud-Est
More info
Commercial space in Năvodari, Sud-Est
Commercial space for rent in Năvodari, Sud-Est
Areal
Ca. 520 m2
Pris pr. md.
Ca. 9,000 EUR per month
Område
Năvodari, Sud-Est
Type
Commercial property
Commercial space in Constanţa, Sud-Est
More info
Commercial space in Constanţa, Sud-Est
Commercial space for rent in Constanţa, Sud-Est
Areal
Ca. 65 m2
Pris pr. md.
Ca. 700 EUR per month
Område
Constanţa, Sud-Est
Type
Commercial property
Commercial space in Valu lui Traian, Sud-Est
More info
Commercial space in Valu lui Traian, Sud-Est
Commercial space for rent in Valu lui Traian, Sud-Est
Areal
Ca. 135 m2
Pris pr. md.
Ca. 1,900 EUR per month
Område
Valu lui Traian, Sud-Est
Type
Commercial property
Commercial space in Constanţa, Sud-Est
More info
Commercial space in Constanţa, Sud-Est
Commercial space for rent in Constanţa, Sud-Est
Areal
Ca. 285 m2
Pris pr. md.
Ca. 950 EUR per month
Område
Constanţa, Sud-Est
Type
Commercial property
Commercial space in Constanţa, Sud-Est
More info
Commercial space in Constanţa, Sud-Est
Commercial space for rent in Constanţa, Sud-Est
Areal
Ca. 285 m2
Pris pr. md.
Ca. 2,000 EUR per month
Område
Constanţa, Sud-Est
Type
Commercial property
Commercial space in Constanţa, Sud-Est
More info
Commercial space in Constanţa, Sud-Est
Commercial space for rent in Constanţa, Sud-Est
Areal
Ca. 285 m2
Pris pr. md.
Ca. 550 EUR per month
Område
Constanţa, Sud-Est
Type
Commercial property
Commercial space in Constanţa, Sud-Est
More info
Commercial space in Constanţa, Sud-Est
Commercial space for rent in Constanţa, Sud-Est
Areal
Ca. 135 m2
Pris pr. md.
Ca. 1,000 EUR per month
Område
Constanţa, Sud-Est
Type
Commercial property
Commercial space in Constanţa, Sud-Est
More info
Commercial space in Constanţa, Sud-Est
Commercial space for rent in Constanţa, Sud-Est
Areal
Ca. 65 m2
Pris pr. md.
Ca. 1,400 EUR per month
Område
Constanţa, Sud-Est
Type
Commercial property
Selected customers


