


Shop for rent, Silkeborg, Central Jutland Region,
, 8600 Silkeborg- Shop for rent
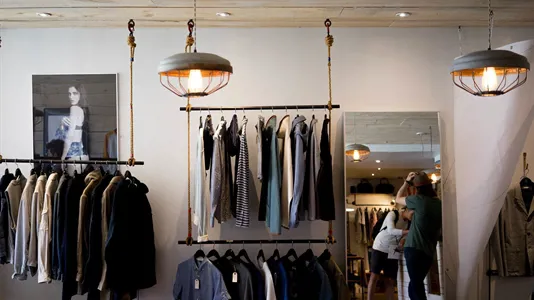
- Ca. 110 m2
- Ca. 12,050 DKK per month
![Shop for rent, Silkeborg, Central Jutland Region, <span class="blurred street" onclick="ProcessAdRequest(3710021)"><span class="hint">See streetname</span>[xxxxxxxxxxxxx]</span>](/StaticFiles/media/313117/Cache/clothing-store-984396_1920_134.webp)
- Shop for rent
- Ca. 110 m2
- Ca. 12,050 DKK per month
⚡ View all details about the space and get direct access to the landlord’s contact information.
Shop for rent, Silkeborg, Central Jutland Region,
Butik til leje i 8600 Silkeborg
Information and data
This company space that can be used as Shop, is located in Silkeborg. Silkeborg is located in in Central Jutland Region. The company space is 111 m2 in total. You can rent this company space for Ca. 144,300 DKK per year.
Similar search results
-
Ca. 30 m2 clinic for rent in Silkeborg, Central Jutland Region

- Ca. 5,000 DKK per month
- Ca. 2,000 DKK /m2/year
-
Ca. 635 m2 industrial property for rent in Silkeborg, Central Jutland Region

- Ca. 12,000 DKK per month
- Ca. 250 DKK /m2/year
-
Ca. 10 m2 clinic for rent in Silkeborg, Central Jutland Region

- Ca. 3,000 DKK per month
- Ca. 3,000 DKK /m2/year
-
Ca. 165 m2 shop for rent in Silkeborg, Central Jutland Region
- Ca. 22,250 DKK per month
- Ca. 1,600 DKK /m2/year
-
Ca. 320 m2 shop for rent in Silkeborg, Central Jutland Region
- Ca. 13,400 DKK per month
- Ca. 500 DKK /m2/year
-
Ca. 210 m2 shop for rent in Silkeborg, Central Jutland Region
- Ca. 19,050 DKK per month
- Ca. 1,100 DKK /m2/year
-
Ca. 85 m2 shop for rent in Silkeborg, Central Jutland Region
- Ca. 17,900 DKK per month
- Ca. 2,450 DKK /m2/year
-
Ca. 230 m2 office space for rent in Silkeborg, Central Jutland Region
- Ca. 13,950 DKK per month
- Ca. 750 DKK /m2/year
-
Ca. 485 m2 office space for rent in Silkeborg, Central Jutland Region
- Ca. 23,400 DKK per month
- Ca. 600 DKK /m2/year


Frequently asked questions
Statistics on the development of available shops for rent in Silkeborg over the past month
Below you can see the development of available shops for rent in Silkeborg over the past month. In the first column you see the date. In the second column you see the total amount of shops for rent in Silkeborg on the date. In the third column you see the amount of new shops in Silkeborg that was available for rent on the date. In the fourth column you see the amount of shops in Silkeborg that was rented on the date. Also see aggregate statistics on all available shops in Silkeborg over time, aggregate statistics on new shops in Silkeborg over time, aggregate statistics on rented shops in Silkeborg over time
| Date | All shops for rent | New shops for rent | Rented out shops |
|---|---|---|---|
| 29. January 2026 | 24 | 0 | 0 |
| 28. January 2026 | 24 | 0 | 0 |
| 27. January 2026 | 24 | 3 | 0 |
| 26. January 2026 | 21 | 0 | 1 |
| 25. January 2026 | 22 | 1 | 1 |
| 24. January 2026 | 22 | 1 | 0 |
| 23. January 2026 | 21 | 0 | 0 |
| 22. January 2026 | 21 | 0 | 0 |
| 21. January 2026 | 21 | 0 | 0 |
| 20. January 2026 | 21 | 0 | 0 |
| 19. January 2026 | 21 | 0 | 0 |
| 18. January 2026 | 21 | 0 | 0 |
| 17. January 2026 | 21 | 0 | 0 |
| 16. January 2026 | 21 | 0 | 0 |
| 15. January 2026 | 21 | 0 | 0 |
| 14. January 2026 | 21 | 0 | 0 |
| 13. January 2026 | 21 | 0 | 0 |
| 12. January 2026 | 21 | 2 | 0 |
| 11. January 2026 | 19 | 0 | 2 |
| 10. January 2026 | 21 | 0 | 1 |
| 9. January 2026 | 22 | 1 | 1 |
| 8. January 2026 | 22 | 1 | 0 |
| 7. January 2026 | 21 | 1 | 0 |
| 6. January 2026 | 20 | 0 | 1 |
| 5. January 2026 | 21 | 0 | 0 |
| 4. January 2026 | 21 | 0 | 0 |
| 3. January 2026 | 21 | 0 | 0 |
| 2. January 2026 | 21 | 0 | 0 |
| 1. January 2026 | 21 | 0 | 0 |
| 31. December 2025 | 21 | 0 | 0 |
| 30. December 2025 | 21 | 0 | 0 |
Statistics on currently available shops for rent in Silkeborg
In the table below, you see a series of data about available shops to rent in Silkeborg.Also see gathered statistics of all available shops in Silkeborg over time, the gathered statistics of new shops in Silkeborg over time, the gathered statistics of rented shops in Silkeborg over time
| Shops | |
|---|---|
| Available premises | 25 |
| New premises since yesterday | 0 |
| Rented out premises since yesterday | 0 |
| Total available m2 | 3,786 |
| Average price per m2 per year without expenses | 174 |
| Highest price per m2 per year | 331 |
| Lowest price per m2 per year | 67 |