


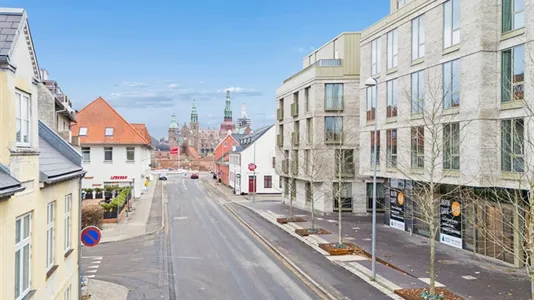
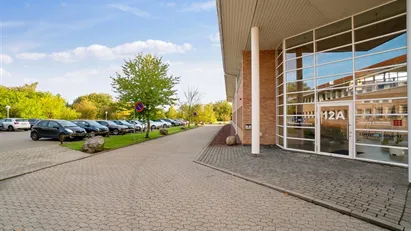
Photo provided by Google Street View and may be inaccurate:
Free contact
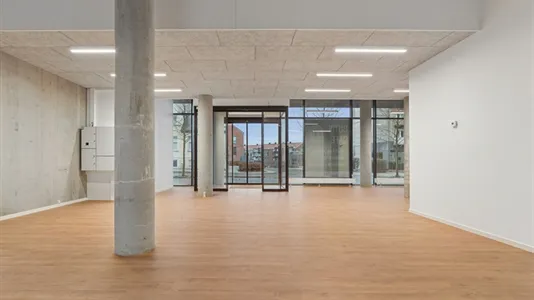
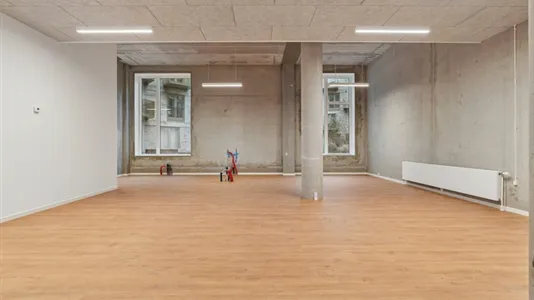
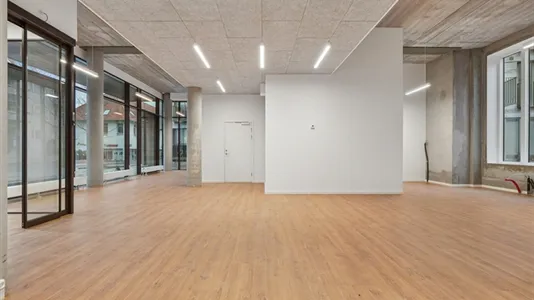
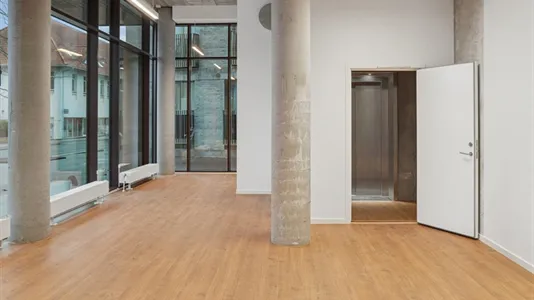
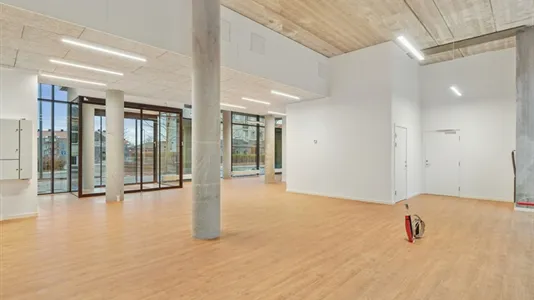
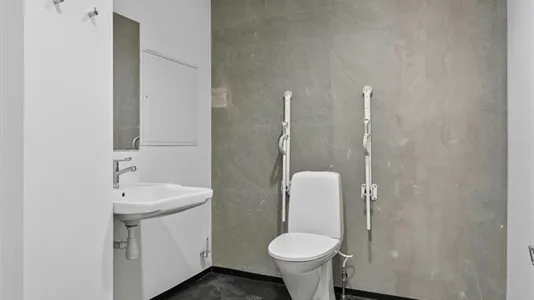
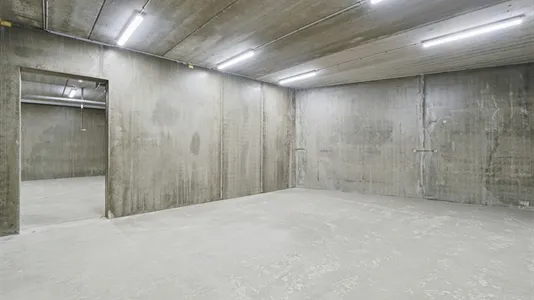
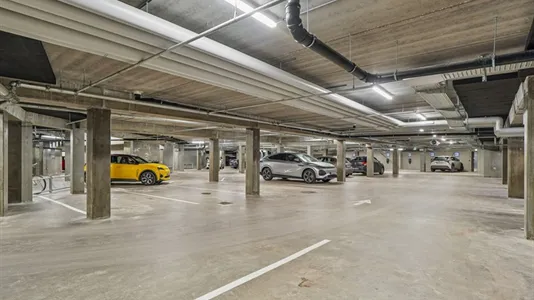
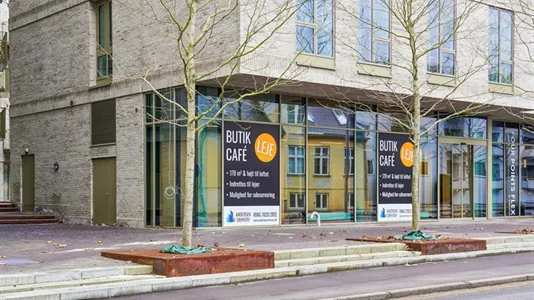
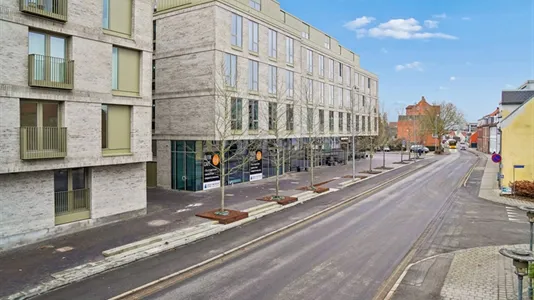
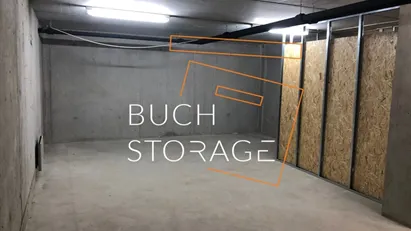
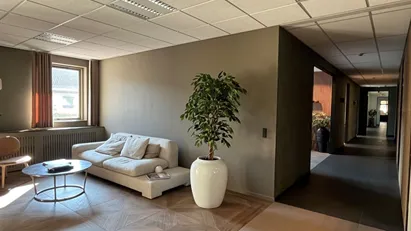
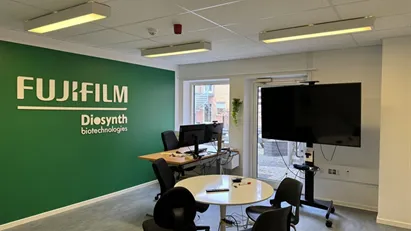
Restaurant for rent, Hillerød, North Zealand, SLANGERUPGADE 5
- 200 m2
- 30,000 DKK per month

GET MORE INFO NOW
⚡See all details about the premise and get direct access to the landlord's contact information.
Restaurant for rent, Hillerød, North Zealand, SLANGERUPGADE 5

200m2

30,000 DKK

Restaurant

Hillerød, North Zealand
Andersen Erhverv
Michelle Arndt
tel: 22784055
Click to see emailxxxxxxxxxxxxxxxxxx
Go to websitexxxxxxxxxxxxx
Michelle Arndt
tel: 22784055
Click to see emailxxxxxxxxxxxxxxxxxx
Go to websitexxxxxxxxxxxxx
PRO-LANDLORD
Read moreRead about the landlord
Facts about the premises
- 26.03.2026
- 2299151
- Restaurant
- 200 m2
- 360,000 DKK
- 30,000 DKK
- 410,000 DKK
- 34,167 DKK
- 1,800 DKK
- 2,050 DKK
Similar premises
Warehouse in Hillerød, North Zealand
More info

Warehouse in Hillerød, North Zealand
Warehouse for rent in Hillerød, North Zealand
Areal
48 - 71 m2
Pris pr. md.
3,556 DKK pr md
Område
Hillerød, North Zealand
Type
Warehouse
Office space in Hillerød, North Zealand
More info

Office space in Hillerød, North Zealand
Office space for rent in Hillerød, North Zealand
Areal
497 - 1,981 m2
Pris pr. md.
141,476 DKK pr md
Område
Hillerød, North Zealand
Type
Office space
Office space in Hillerød, North Zealand
More info
Office space in Hillerød, North Zealand
Office space for rent in Hillerød, North Zealand
Areal
349 m2
Pris pr. md.
24,924 DKK pr md
Område
Hillerød, North Zealand
Type
Office space
Showroom in Hillerød, North Zealand
More info
Showroom in Hillerød, North Zealand
Showroom for rent in Hillerød, North Zealand
Areal
558 m2
Pris pr. md.
30,830 DKK pr md
Område
Hillerød, North Zealand
Type
Showroom
Office space in Hillerød, North Zealand
More info
Office space in Hillerød, North Zealand
Office space for rent in Hillerød, North Zealand
Areal
497 m2
Pris pr. md.
26,921 DKK pr md
Område
Hillerød, North Zealand
Type
Office space
Restaurant in Hillerød, North Zealand
More info
We monitor the market!
Restaurant in Hillerød, North Zealand
Restaurant for rent in Hillerød, North Zealand
Areal
Ca. 55 m2
Pris pr. md.
Ca. 6,200 DKK pr md
Område
Hillerød, North Zealand
Type
Restaurant
Restaurant in Hillerød, North Zealand
More info
We monitor the market!
Restaurant in Hillerød, North Zealand
Restaurant for rent in Hillerød, North Zealand
Areal
Ca. 435 m2
Pris pr. md.
Ca. 46,700 DKK pr md
Område
Hillerød, North Zealand
Type
Restaurant
Selected customers
30,000 customers use Companyspace.com
30,000 customers
285,000 companies in our database
2,400 rentals annually
Companyspace.com is used by thousands of landlords, property companies, commercial real estate agents, investors and business centres seeking greater visibility, more enquiries and lower vacancy rates.


