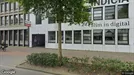
Office space for rent, Tilburg, North Brabant,
, Tilburg- Office space for rent
- Ca. 200 m2
- Office space for rent
- Ca. 200 m2
⚡ View all details about the space and get direct access to the landlord’s contact information.
Office space for rent, Tilburg, North Brabant,
Office space for rent in Tilburg, North Brabant
Similar search results
-
Ca. 850 m2 office space for rent in Tilburg, North Brabant
- Ca. 7,900 EUR per month
- Ca. 100 EUR /m2/year
-
Ca. 175 m2 office space for rent in Tilburg, North Brabant
- Ca. 1,450 EUR per month
- Ca. 100 EUR /m2/year
-
Ca. 35 m2 office space for rent in Tilburg, North Brabant
- Ca. 1,100 EUR per month
- Ca. 400 EUR /m2/year
-
Ca. 110 m2 office space for rent in Tilburg, North Brabant
- Ca. 4,000 EUR per month
- Ca. 450 EUR /m2/year
-
Ca. 505 m2 office space for rent in Tilburg, North Brabant
- Ca. 50 EUR per month
- Ca. 50 EUR /m2/year
-
Ca. 180 m2 industrial property for rent in Tilburg, North Brabant
- Ca. 2,700 EUR per month
- Ca. 200 EUR /m2/year
-
Ca. 1,335 m2 industrial property for rent in Tilburg, North Brabant
- Ca. 8,750 EUR per month
- Ca. 100 EUR /m2/year
-
Ca. 245 m2 restaurant for rent in Tilburg, North Brabant
- Ca. 3,250 EUR per month
- Ca. 150 EUR /m2/year
Frequently asked questions
Statistics on the development of available office spaces for rent in Tilburg over the past month
Below you can see the development of available office spaces for rent in Tilburg over the past month. In the first column you see the date. In the second column you see the total amount of office spaces for rent in Tilburg on the date. In the third column you see the amount of new office spaces in Tilburg that was available for rent on the date. In the fourth column you see the amount of office spaces in Tilburg that was rented on the date. Also see aggregate statistics on all available office spaces in Tilburg over time, aggregate statistics on new office spaces in Tilburg over time, aggregate statistics on rented office spaces in Tilburg over time
| Date | All office spaces for rent | New office spaces for rent | Rented out office spaces |
|---|---|---|---|
| 6. April 2026 | 62 | 0 | 0 |
| 5. April 2026 | 62 | 3 | 6 |
| 4. April 2026 | 65 | 3 | 0 |
| 3. April 2026 | 62 | 0 | 3 |
| 2. April 2026 | 65 | 3 | 4 |
| 1. April 2026 | 66 | 3 | 0 |
| 31. March 2026 | 63 | 0 | 0 |
| 30. March 2026 | 63 | 0 | 3 |
| 29. March 2026 | 66 | 0 | 0 |
| 28. March 2026 | 66 | 3 | 3 |
| 27. March 2026 | 66 | 0 | 0 |
| 25. March 2026 | 66 | 0 | 0 |
| 24. March 2026 | 66 | 0 | 3 |
| 23. March 2026 | 69 | 0 | 0 |
| 22. March 2026 | 69 | 0 | 0 |
| 21. March 2026 | 69 | 1 | 1 |
| 20. March 2026 | 69 | 1 | 0 |
| 19. March 2026 | 68 | 1 | 3 |
| 18. March 2026 | 70 | 1 | 0 |
| 17. March 2026 | 69 | 3 | 3 |
| 16. March 2026 | 69 | 3 | 0 |
| 15. March 2026 | 66 | 0 | 3 |
| 14. March 2026 | 69 | 2 | 2 |
| 13. March 2026 | 69 | 2 | 0 |
| 12. March 2026 | 67 | 1 | 0 |
| 11. March 2026 | 66 | 0 | 1 |
| 10. March 2026 | 67 | 1 | 1 |
| 9. March 2026 | 67 | 0 | 0 |
| 8. March 2026 | 67 | 2 | 0 |
| 7. March 2026 | 65 | 0 | 0 |
Statistics on currently available office spaces for rent in Tilburg
In the table below, you see a series of data about available office spaces to rent in Tilburg.Also see gathered statistics of all available office spaces in Tilburg over time, the gathered statistics of new office spaces in Tilburg over time, the gathered statistics of rented office spaces in Tilburg over time
| Office spaces | |
|---|---|
| Available premises | 62 |
| New premises since yesterday | 0 |
| Rented out premises since yesterday | 0 |
| Total available m2 | 34,592 |
| Average price per m2 per year without expenses | 163 |
| Highest price per m2 per year | 538.8 |
| Lowest price per m2 per year | 1.28 |