


Office space for rent in Europe
There are 129,449 available office spaces in Europe right now. Companyspace.com collects office spaces from many different parts of the market, so that you as a company can more easily get an overview of available office spaces in Europe.
Companyspace.com today:
New today 2,877
Updated 24h 3,953
Notifications about new companyspaces1,241
Amsterdam +3
Berlin +3
Paris +5
Madrid +4
Dublin (county) +23
Warsaw +19
Greater London +12
Latest update 9 min ago
Active ads 368,919
129,449 office spaces found
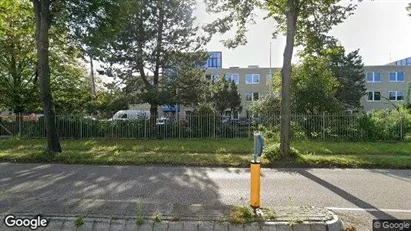
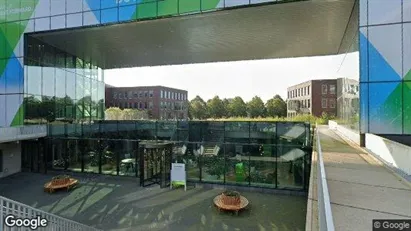
Office space in Zoetermeer, South Holland
 More info
Office space in Zoetermeer, South Holland
Office space for rent in Zoetermeer, South Holland
Areal
Ca. 720 m2
Pris pr. md.
Not stated
Område
Zoetermeer, South Holland
Type
Office space
Office space in Antwerp Berchem, Antwerp
 More info
Office space in Antwerp Berchem, Antwerp
Office space for rent in Antwerp Berchem, Antwerp
Areal
Ca. 9,735 m2
Pris pr. md.
Ca. 2,400 EUR pr md
Område
Antwerp Berchem, Antwerp
Type
Office space
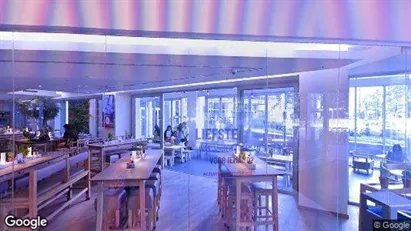
Office space in Haarlemmerliede en Spaarnwoude, North Holland
 More info
Office space in Haarlemmerliede en Spaarnwoude, North Holland
Nieuw in de verhuur, Office Hotel Sugarcity!
- Tussen Amsterdam en Haarlem in
- Direct naast het station gelegen
- Parkeren op eigen terrein
Op z...
Areal
Ca. 120 m2
Pris pr. md.
Ca. 8,350 EUR pr md
Område
Haarlemmerliede en Spaarnwoude, North Holland
Type
Office space
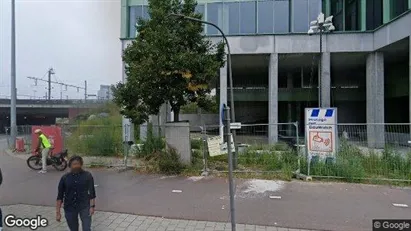
Office space in Rotterdam Centrum, Rotterdam
 More info
Office space in Rotterdam Centrum, Rotterdam
Office space for rent in Rotterdam Centrum, Rotterdam
Areal
Ca. 10 m2
Pris pr. md.
Ca. 800 EUR pr md
Område
Rotterdam Centrum, Rotterdam
Type
Office space
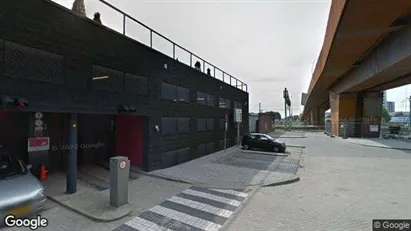
Office space in Rotterdam Delfshaven, Rotterdam
 More info
Office space in Rotterdam Delfshaven, Rotterdam
In bedrijfsverzamelgebouw “De Fabriek van Delfshaven” is een kantoorunit vrij! Je kunt daarnaast ook ongelimiteerd gebruik maken van de gemeenschappelijke ru...
Areal
24 - 60 m2
Pris pr. md.
Ca. 8,350 EUR pr md
Område
Rotterdam Delfshaven, Rotterdam
Type
Office space
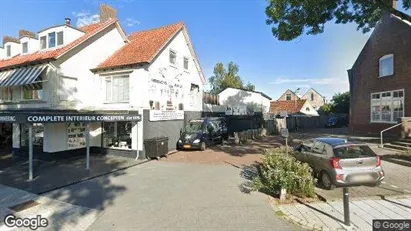
Office space in Giessenlanden, South Holland
 More info
Office space in Giessenlanden, South Holland
Office space for rent in Giessenlanden, South Holland
Areal
Ca. 45 m2
Pris pr. md.
Ca. 500 EUR pr md
Område
Giessenlanden, South Holland
Type
Office space
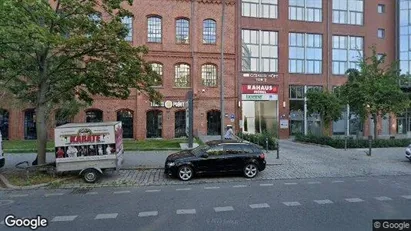
Office space in Hengelo, Overijssel
 More info
Office space in Hengelo, Overijssel
In het centrum van Hengelo Ov. is momenteel - in het kantoorgebouw waar o.a. ook een vestiging van ten Hag makelaars is gevestigd - ca. 110 m² kantoorruimte ...
Areal
Ca. 575 m2
Pris pr. md.
Not stated
Område
Hengelo, Overijssel
Type
Office space
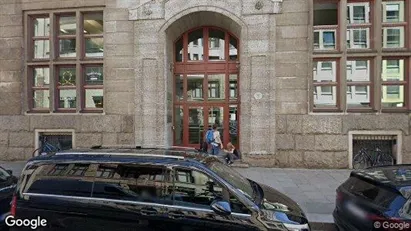
Office space in Hamburg Mitte, Hamburg
 More info
Office space in Hamburg Mitte, Hamburg
Office space for rent in Hamburg Mitte, Hamburg
Areal
132 - 3,338 m2
Pris pr. md.
Not stated
Område
Hamburg Mitte, Hamburg
Type
Office space
Office space in Turku, Varsinais-Suomi
 More info
Office space in Turku, Varsinais-Suomi
Office space for rent in Turku, Varsinais-Suomi
Areal
Ca. 80 m2
Pris pr. md.
Not stated
Område
Turku, Varsinais-Suomi
Type
Office space
Office space in Haarlemmerliede en Spaarnwoude, North Holland
 More info
Office space in Haarlemmerliede en Spaarnwoude, North Holland
Nieuw in de verhuur, Office Hotel Sugarcity!
- Tussen Amsterdam en Haarlem in
- Direct naast het station gelegen
- Parkeren op eigen terrein
Op zoek ...
Areal
Ca. 30 m2
Pris pr. md.
Ca. 8,350 EUR pr md
Område
Haarlemmerliede en Spaarnwoude, North Holland
Type
Office space
Office space in Utrecht Zuid-West, Utrecht
 More info
Office space in Utrecht Zuid-West, Utrecht
Office space for rent in Utrecht Zuid-West, Utrecht
Areal
Ca. 200 m2
Pris pr. md.
Ca. 2,950 EUR pr md
Område
Utrecht Zuid-West, Utrecht
Type
Office space
Office space in Zoetermeer, South Holland
 More info
Office space in Zoetermeer, South Holland
Office space for rent in Zoetermeer, South Holland
Areal
Ca. 16,035 m2
Pris pr. md.
Not stated
Område
Zoetermeer, South Holland
Type
Office space
Office space in Hamburg Mitte, Hamburg
 More info
Office space in Hamburg Mitte, Hamburg
Office space for rent in Hamburg Mitte, Hamburg
Areal
284 - 1,807 m2
Pris pr. md.
Not stated
Område
Hamburg Mitte, Hamburg
Type
Office space
Office space in Den Bosch, North Brabant
 More info
Office space in Den Bosch, North Brabant
Office space for rent in Den Bosch, North Brabant
Areal
Ca. 960 m2
Pris pr. md.
Not stated
Område
Den Bosch, North Brabant
Type
Office space
Office space in Berlin Charlottenburg-Wilmersdorf, Berlin
 More info
Office space in Berlin Charlottenburg-Wilmersdorf, Berlin
Office space for rent in Berlin Charlottenburg-Wilmersdorf, Berlin
Areal
Ca. 2,835 m2
Pris pr. md.
Not stated
Område
Berlin Charlottenburg-Wilmersdorf, Berlin
Type
Office space
Office space in Kortrijk, West-Vlaanderen
 More info
Office space in Kortrijk, West-Vlaanderen
Office space for rent in Kortrijk, West-Vlaanderen
Areal
Ca. 425 m2
Pris pr. md.
Ca. 5,150 EUR pr md
Område
Kortrijk, West-Vlaanderen
Type
Office space
Office space in San Sebastián de los Reyes, Comunidad de Madrid
 More info
Office space in San Sebastián de los Reyes, Comunidad de Madrid
Office space for rent in San Sebastián de los Reyes, Comunidad de Madrid
Areal
Ca. 60 m2
Pris pr. md.
Ca. 500 EUR pr md
Område
San Sebastián de los Reyes, Comunidad de Madrid
Type
Office space
Warehouse in Sunds, Central Jutland Region
 More info
Warehouse in Sunds, Central Jutland Region
Warehouse for rent in Sunds, Central Jutland Region
Areal
Ca. 235 m2
Pris pr. md.
Ca. 10,000 DKK pr md
Område
Sunds, Central Jutland Region
Type
Warehouse
Selected customers
30,000 customers use Companyspace.com
30,000 customers
285,000 companies in our database
2,400 rentals annually
Companyspace.com is used by thousands of landlords, property companies, commercial real estate agents, investors and business centres seeking greater visibility, more enquiries and lower vacancy rates.


