


Office space for rent in Europe
There are 129,449 available office spaces in Europe right now. Companyspace.com collects office spaces from many different parts of the market, so that you as a company can more easily get an overview of available office spaces in Europe.
Companyspace.com today:
New today 2,877
Updated 24h 3,953
Notifications about new companyspaces1,241
Amsterdam +3
Berlin +3
Paris +5
Madrid +4
Dublin (county) +23
Warsaw +19
Greater London +12
Latest update 10 min ago
Active ads 368,919
129,449 office spaces found
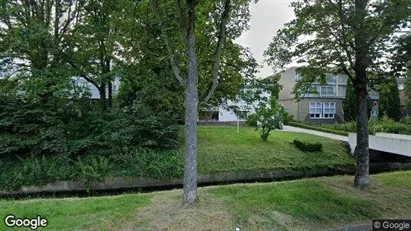
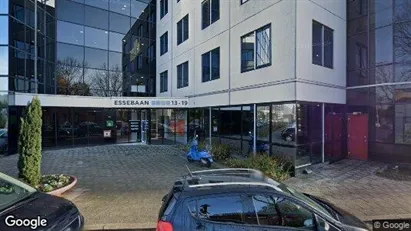
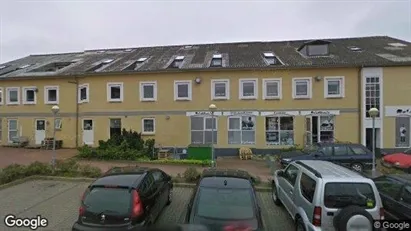
Office space in Sittard-Geleen, Limburg
 More info
Office space in Sittard-Geleen, Limburg
Atelier Wielders:
Een verzamelplek van creatieve en eigenzinnige ondernemers in de wereld van ontwerp en zorggelegen in een rijks monumentale kantoorvilla...
Areal
Ca. 25 m2
Pris pr. md.
Ca. 8,350 EUR pr md
Område
Sittard-Geleen, Limburg
Type
Office space
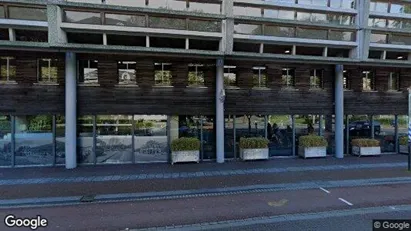
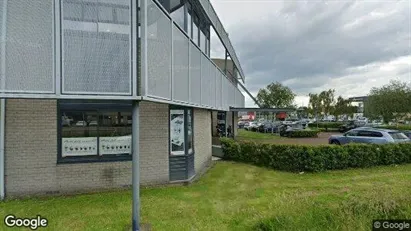
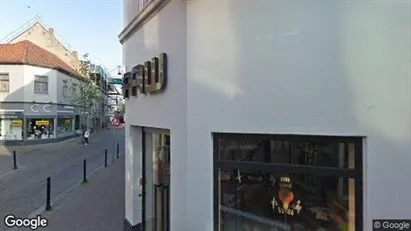
Office space in Haarlem, North Holland
 More info
Office space in Haarlem, North Holland
Office space for rent in Haarlem, North Holland
Areal
Ca. 65 m2
Pris pr. md.
Ca. 2,450 EUR pr md
Område
Haarlem, North Holland
Type
Office space
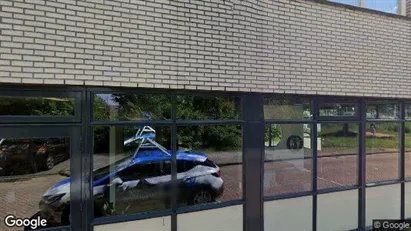
Office space in Papendrecht, South Holland
 More info
Office space in Papendrecht, South Holland
Kantoor te huur in Papendrecht, Zuid-Holland
Areal
Ca. 125 m2
Pris pr. md.
Ca. 1,450 EUR pr md
Område
Papendrecht, South Holland
Type
Office space
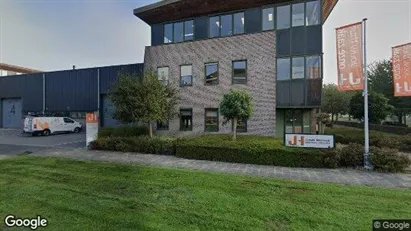
Office space in Eindhoven, North Brabant
 More info
Office space in Eindhoven, North Brabant
Office space for rent in Eindhoven, North Brabant
Areal
Ca. 980 m2
Pris pr. md.
Not stated
Område
Eindhoven, North Brabant
Type
Office space
Office space in Haarlemmermeer, North Holland
 More info
Office space in Haarlemmermeer, North Holland
Office space for rent in Haarlemmermeer, North Holland
Areal
Ca. 50 m2
Pris pr. md.
Ca. 2,250 EUR pr md
Område
Haarlemmermeer, North Holland
Type
Office space
Office space in Haarlemmermeer, North Holland
 More info
Office space in Haarlemmermeer, North Holland
Office space for rent in Haarlemmermeer, North Holland
Areal
Ca. 45 m2
Pris pr. md.
Ca. 1,750 EUR pr md
Område
Haarlemmermeer, North Holland
Type
Office space
Office space in Aalter, Oost-Vlaanderen
 More info
Office space in Aalter, Oost-Vlaanderen
Office space for rent in Aalter, Oost-Vlaanderen
Areal
Ca. 110 m2
Pris pr. md.
Ca. 1,350 EUR pr md
Område
Aalter, Oost-Vlaanderen
Type
Office space
Office space in Maastricht, Limburg
 More info
Office space in Maastricht, Limburg
Dit fraaie kantoorpand met monumentale allure is prima gelegen aan de chique Wilhelminasingel in Wyck, aan de rand van het historische centrum van Maastricht...
Areal
65 - 355 m2
Pris pr. md.
Ca. 8,350 EUR pr md
Område
Maastricht, Limburg
Type
Office space
Office space in Mikkeli, Etelä-Savo
 More info
Office space in Mikkeli, Etelä-Savo
Office space for rent in Mikkeli, Etelä-Savo
Areal
-
Pris pr. md.
Not stated
Område
Mikkeli, Etelä-Savo
Type
Office space
Office space in Haarlemmermeer, North Holland
 More info
Office space in Haarlemmermeer, North Holland
Office space for rent in Haarlemmermeer, North Holland
Areal
Ca. 95 m2
Pris pr. md.
Ca. 1,750 EUR pr md
Område
Haarlemmermeer, North Holland
Type
Office space
Office space in Houten, Province of Utrecht
 More info
Office space in Houten, Province of Utrecht
Office space for rent in Houten, Province of Utrecht
Areal
Ca. 300 m2
Pris pr. md.
Not stated
Område
Houten, Province of Utrecht
Type
Office space
Office space in Capelle aan den IJssel, South Holland
 More info
Office space in Capelle aan den IJssel, South Holland
Office space for rent in Capelle aan den IJssel, South Holland
Areal
Ca. 330 m2
Pris pr. md.
Ca. 2,750 EUR pr md
Område
Capelle aan den IJssel, South Holland
Type
Office space
Office space in Zaanstad, North Holland
 More info
Office space in Zaanstad, North Holland
Office space for rent in Zaanstad, North Holland
Areal
-
Pris pr. md.
Ca. 900 EUR pr md
Område
Zaanstad, North Holland
Type
Office space
Office space in Haarlem, North Holland
 More info
Office space in Haarlem, North Holland
Office space for rent in Haarlem, North Holland
Areal
Ca. 85 m2
Pris pr. md.
Ca. 3,150 EUR pr md
Område
Haarlem, North Holland
Type
Office space
Office space in Imatra, Etelä-Karjala
 More info
Office space in Imatra, Etelä-Karjala
Office space for rent in Imatra, Etelä-Karjala
Areal
Ca. 670 m2
Pris pr. md.
Not stated
Område
Imatra, Etelä-Karjala
Type
Office space
Office space in Horsens, Central Jutland Region
 More info
Office space in Horsens, Central Jutland Region
Office space for rent in Horsens, Central Jutland Region
Areal
Ca. 350 m2
Pris pr. md.
Ca. 27,700 DKK pr md
Område
Horsens, Central Jutland Region
Type
Office space
Office space in Faaborg, Funen
 More info
Office space in Faaborg, Funen
Office space for rent in Faaborg, Funen
Areal
Ca. 250 m2
Pris pr. md.
Ca. 12,400 DKK pr md
Område
Faaborg, Funen
Type
Office space
Office space in Randers C, Randers
 More info
Office space in Randers C, Randers
Office space for rent in Randers C, Randers
Areal
Ca. 120 m2
Pris pr. md.
Ca. 4,800 DKK pr md
Område
Randers C, Randers
Type
Office space
Selected customers
30,000 customers use Companyspace.com
30,000 customers
285,000 companies in our database
2,400 rentals annually
Companyspace.com is used by thousands of landlords, property companies, commercial real estate agents, investors and business centres seeking greater visibility, more enquiries and lower vacancy rates.


