


Office space for rent in Europe
There are 129,449 available office spaces in Europe right now. Companyspace.com collects office spaces from many different parts of the market, so that you as a company can more easily get an overview of available office spaces in Europe.
Companyspace.com today:
New today 2,877
Updated 24h 3,953
Notifications about new companyspaces1,241
Amsterdam +3
Berlin +3
Paris +5
Madrid +4
Dublin (county) +23
Warsaw +19
Greater London +12
Latest update 10 min ago
Active ads 368,919
129,449 office spaces found
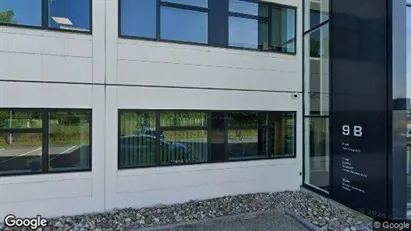
Office space in Herlev, Greater Copenhagen
 More info
Office space in Herlev, Greater Copenhagen
Office space for rent in Herlev, Greater Copenhagen
Areal
Ca. 90 m2
Pris pr. md.
Ca. 7,500 DKK pr md
Område
Herlev, Greater Copenhagen
Type
Office space
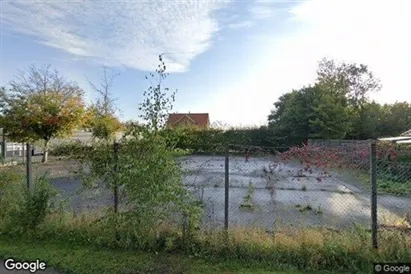
Office space in Johanneberg, Gothenburg
 More info
Office space in Johanneberg, Gothenburg
Office space for rent in Johanneberg, Gothenburg
Areal
150 - 554 m2
Pris pr. md.
Not stated
Område
Johanneberg, Gothenburg
Type
Office space
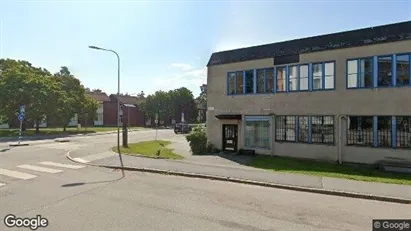
Office space in Hillerød, North Zealand
 More info
Office space in Hillerød, North Zealand
Office space for rent in Hillerød, North Zealand
Areal
Ca. 155 m2
Pris pr. md.
Ca. 12,750 DKK pr md
Område
Hillerød, North Zealand
Type
Office space
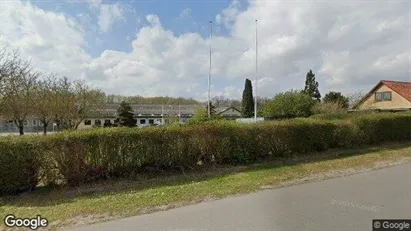
Office space in Nordhavn, Copenhagen
 More info
Office space in Nordhavn, Copenhagen
Office space for rent in Nordhavn, Copenhagen
Areal
Ca. 4,760 m2
Pris pr. md.
Not stated
Område
Nordhavn, Copenhagen
Type
Office space
Clinic in Odense SØ, Odense
 More info
Clinic in Odense SØ, Odense
Clinic for rent in Odense SØ, Odense
Areal
Ca. 45 m2
Pris pr. md.
Ca. 6,000 DKK pr md
Område
Odense SØ, Odense
Type
Clinic
Office space in Stockholm South, Stockholm
 More info
Office space in Stockholm South, Stockholm
Office space for rent in Stockholm South, Stockholm
Areal
Ca. 195 m2
Pris pr. md.
Ca. 24,400 SEK pr md
Område
Stockholm South, Stockholm
Type
Office space
Office space in Odense N, Odense
 More info
Office space in Odense N, Odense
Office space for rent in Odense N, Odense
Areal
10 - 20 m2
Pris pr. md.
Ca. 1,800 DKK pr md
Område
Odense N, Odense
Type
Office space
Office space in Stockholm South, Stockholm
 More info
Office space in Stockholm South, Stockholm
Office space for rent in Stockholm South, Stockholm
Areal
Ca. 125 m2
Pris pr. md.
Ca. 20,500 SEK pr md
Område
Stockholm South, Stockholm
Type
Office space
Office space in Dilbeek, Vlaams-Brabant
 More info
Office space in Dilbeek, Vlaams-Brabant
Office space for rent in Dilbeek, Vlaams-Brabant
Areal
-
Pris pr. md.
Ca. 5,950 EUR pr md
Område
Dilbeek, Vlaams-Brabant
Type
Office space
Office space in Hvidovre, Greater Copenhagen
 More info
Office space in Hvidovre, Greater Copenhagen
Office space for rent in Hvidovre, Greater Copenhagen
Areal
Ca. 515 m2
Pris pr. md.
Ca. 36,650 DKK pr md
Område
Hvidovre, Greater Copenhagen
Type
Office space
Office space in Herlev, Greater Copenhagen
 More info
Office space in Herlev, Greater Copenhagen
Office space for rent in Herlev, Greater Copenhagen
Areal
Ca. 90 m2
Pris pr. md.
Ca. 7,500 DKK pr md
Område
Herlev, Greater Copenhagen
Type
Office space
Office space in Herlev, Greater Copenhagen
 More info
Office space in Herlev, Greater Copenhagen
Office space for rent in Herlev, Greater Copenhagen
Areal
Ca. 115 m2
Pris pr. md.
Ca. 9,550 DKK pr md
Område
Herlev, Greater Copenhagen
Type
Office space
Office space in Haslev, Region Zealand
 More info
Office space in Haslev, Region Zealand
Office space for rent in Haslev, Region Zealand
Areal
Ca. 70 m2
Pris pr. md.
Ca. 8,200 DKK pr md
Område
Haslev, Region Zealand
Type
Office space
Office space in Malmö City, Malmö
 More info
Office space in Malmö City, Malmö
Office space for rent in Malmö City, Malmö
Areal
Ca. 165 m2
Pris pr. md.
Ca. 17,950 SEK pr md
Område
Malmö City, Malmö
Type
Office space
Office space in Hadsten, Central Jutland Region
 More info
Office space in Hadsten, Central Jutland Region
Office space for rent in Hadsten, Central Jutland Region
Areal
Ca. 120 m2
Pris pr. md.
Ca. 10,800 DKK pr md
Område
Hadsten, Central Jutland Region
Type
Office space
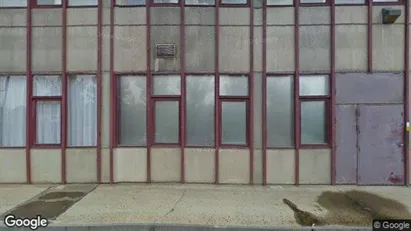
Office space in Tim, Central Jutland Region
 More info
Office space in Tim, Central Jutland Region
Office space for rent in Tim, Central Jutland Region
Areal
Ca. 300 m2
Pris pr. md.
Ca. 12,500 DKK pr md
Område
Tim, Central Jutland Region
Type
Office space
Warehouse in Middelfart, Funen
 More info
Warehouse in Middelfart, Funen
Warehouse for rent in Middelfart, Funen
Areal
550 - 2,500 m2
Pris pr. md.
Ca. 119,800 DKK pr md
Område
Middelfart, Funen
Type
Warehouse
Office space in Gothenburg East, Gothenburg
 More info
Office space in Gothenburg East, Gothenburg
Office space for rent in Gothenburg East, Gothenburg
Areal
Ca. 1,015 m2
Pris pr. md.
Not stated
Område
Gothenburg East, Gothenburg
Type
Office space
Selected customers
30,000 customers use Companyspace.com
30,000 customers
285,000 companies in our database
2,400 rentals annually
Companyspace.com is used by thousands of landlords, property companies, commercial real estate agents, investors and business centres seeking greater visibility, more enquiries and lower vacancy rates.


