


Office space for rent in Europe
There are 129,649 available office spaces in Europe right now. Companyspace.com collects office spaces from many different parts of the market, so that you as a company can more easily get an overview of available office spaces in Europe.
Companyspace.com today:
New today 2,899
Updated 24h 3,921
Notifications about new companyspaces1,962
Copenhagen +2
Stockholm +1
Amsterdam +3
Berlin +3
Vienna +6
Paris +5
Madrid +4
Dublin (county) +23
Warsaw +19
Greater London +13
Latest update 7 min ago
Active ads 369,114
129,649 office spaces found
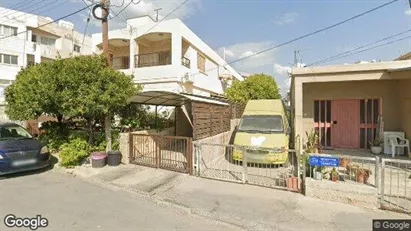
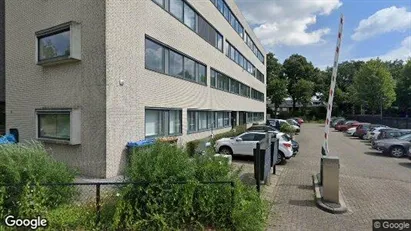
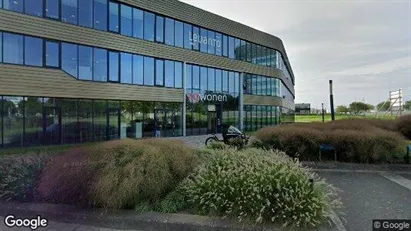
Office space in Mesa Geitonia, Limassol (Eparchies)
 More info
Office space in Mesa Geitonia, Limassol (Eparchies)
Office space for rent in Mesa Geitonia, Limassol (Eparchies)
Areal
Ca. 235 m2
Pris pr. md.
Ca. 15,300 EUR pr md
Område
Mesa Geitonia, Limassol (Eparchies)
Type
Office space
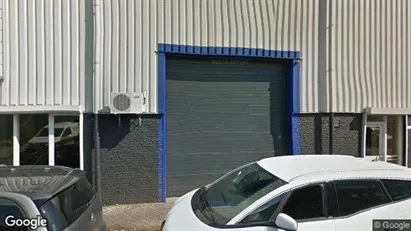
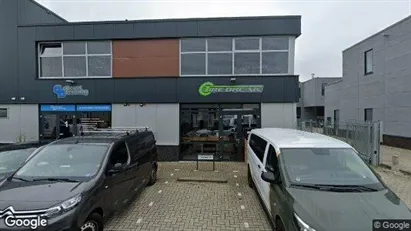
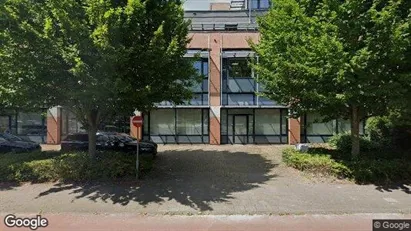
Office space in Etten-Leur, North Brabant
 More info
Office space in Etten-Leur, North Brabant
Office space for rent in Etten-Leur, North Brabant
Areal
18 - 198 m2
Pris pr. md.
Ca. 300 EUR pr md
Område
Etten-Leur, North Brabant
Type
Office space
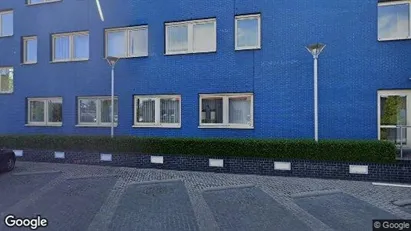
Office space in Nørrebro, Copenhagen
 More info
Office space in Nørrebro, Copenhagen
Office space for rent in Nørrebro, Copenhagen
Areal
Ca. 40 m2
Pris pr. md.
Ca. 7,000 DKK pr md
Område
Nørrebro, Copenhagen
Type
Office space
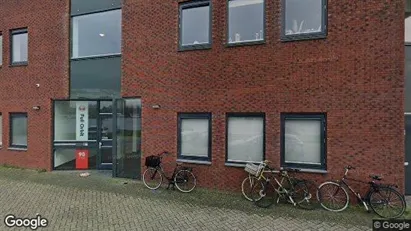
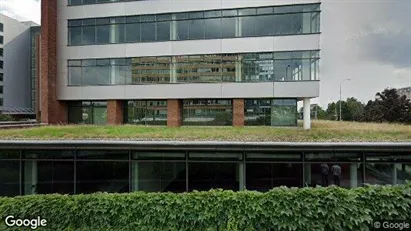
Office space in Deventer, Overijssel
 More info
Office space in Deventer, Overijssel
Office space for rent in Deventer, Overijssel
Areal
348 - 4,115 m2
Pris pr. md.
Not stated
Område
Deventer, Overijssel
Type
Office space
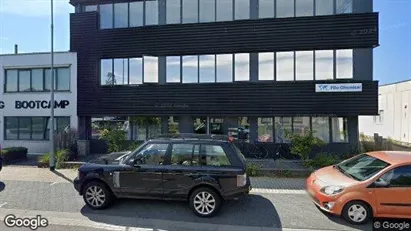
Office space in Breda, North Brabant
 More info
Office space in Breda, North Brabant
Office space for rent in Breda, North Brabant
Areal
370 - 1,201 m2
Pris pr. md.
Not stated
Område
Breda, North Brabant
Type
Office space
Office space in Breda, North Brabant
 More info
Office space in Breda, North Brabant
Office space for rent in Breda, North Brabant
Areal
18 - 349 m2
Pris pr. md.
Ca. 200 EUR pr md
Område
Breda, North Brabant
Type
Office space
Office space in Haarlemmermeer, North Holland
 More info
Office space in Haarlemmermeer, North Holland
Office space for rent in Haarlemmermeer, North Holland
Areal
Ca. 200 m2
Pris pr. md.
Ca. 2,200 EUR pr md
Område
Haarlemmermeer, North Holland
Type
Office space
Office space in Apeldoorn, Gelderland
 More info
Office space in Apeldoorn, Gelderland
Office space for rent in Apeldoorn, Gelderland
Areal
45 - 106 m2
Pris pr. md.
Not stated
Område
Apeldoorn, Gelderland
Type
Office space
Office space in Haarlem, North Holland
 More info
Office space in Haarlem, North Holland
Office space for rent in Haarlem, North Holland
Areal
Ca. 175 m2
Pris pr. md.
Ca. 1,750 EUR pr md
Område
Haarlem, North Holland
Type
Office space
Office space in Sittard-Geleen, Limburg
 More info
Office space in Sittard-Geleen, Limburg
Office space for rent in Sittard-Geleen, Limburg
Areal
-
Pris pr. md.
Not stated
Område
Sittard-Geleen, Limburg
Type
Office space
Office space in Bloemendaal, North Holland
 More info
Office space in Bloemendaal, North Holland
Office space for rent in Bloemendaal, North Holland
Areal
Ca. 70 m2
Pris pr. md.
Ca. 700 EUR pr md
Område
Bloemendaal, North Holland
Type
Office space
Office space in Breda, North Brabant
 More info
Office space in Breda, North Brabant
Office space for rent in Breda, North Brabant
Areal
220 - 447 m2
Pris pr. md.
Not stated
Område
Breda, North Brabant
Type
Office space
Office space in Zwolle, Overijssel
 More info
Office space in Zwolle, Overijssel
Office space for rent in Zwolle, Overijssel
Areal
112 - 1,102 m2
Pris pr. md.
Not stated
Område
Zwolle, Overijssel
Type
Office space
Office space in Vlissingen, Zeeland
 More info
Office space in Vlissingen, Zeeland
Office space for rent in Vlissingen, Zeeland
Areal
Ca. 160 m2
Pris pr. md.
Ca. 1,650 EUR pr md
Område
Vlissingen, Zeeland
Type
Office space
Office space in Leeuwarden, Friesland NL
 More info
Office space in Leeuwarden, Friesland NL
Office space for rent in Leeuwarden, Friesland NL
Areal
Ca. 100 m2
Pris pr. md.
Ca. 350 EUR pr md
Område
Leeuwarden, Friesland NL
Type
Office space
Office space in Prague 5, Prague
 More info
Office space in Prague 5, Prague
Office space for rent in Prague 5, Prague
Areal
Ca. 925 m2
Pris pr. md.
Ca. 350 CZK pr md
Område
Prague 5, Prague
Type
Office space
Office space in Middelburg, Zeeland
 More info
Office space in Middelburg, Zeeland
Office space for rent in Middelburg, Zeeland
Areal
Ca. 65 m2
Pris pr. md.
Ca. 1,200 EUR pr md
Område
Middelburg, Zeeland
Type
Office space
Office space in Augsburg, Bayern
 More info
Office space in Augsburg, Bayern
Office space for rent in Augsburg, Bayern
Areal
Ca. 195 m2
Pris pr. md.
Not stated
Område
Augsburg, Bayern
Type
Office space
Selected customers
30,000 customers use Companyspace.com
30,000 customers
285,000 companies in our database
2,400 rentals annually
Companyspace.com is used by thousands of landlords, property companies, commercial real estate agents, investors and business centres seeking greater visibility, more enquiries and lower vacancy rates.


